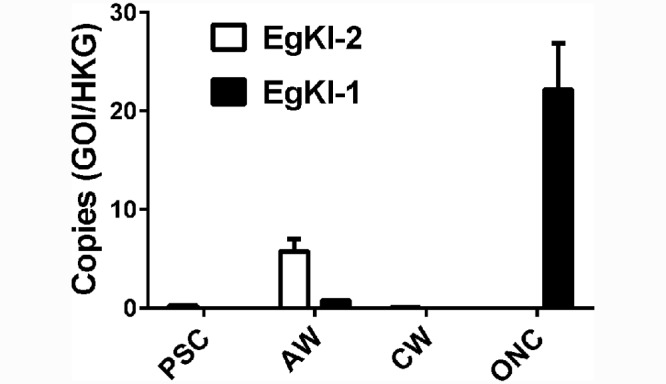
Fig 3. Normalized expression levels of the EgKI genes in E. granulosus.

The Y axis represents the number of copies after dividing the number of copies of either gene of interest (GOI) by the number of copies of the house keeping gene (HKG). PSC, protoscoleces; AW, adult worms; HCM, hydatid cyst membrane; ONC, oncospheres. Error bars represent the mean ± SEM.
