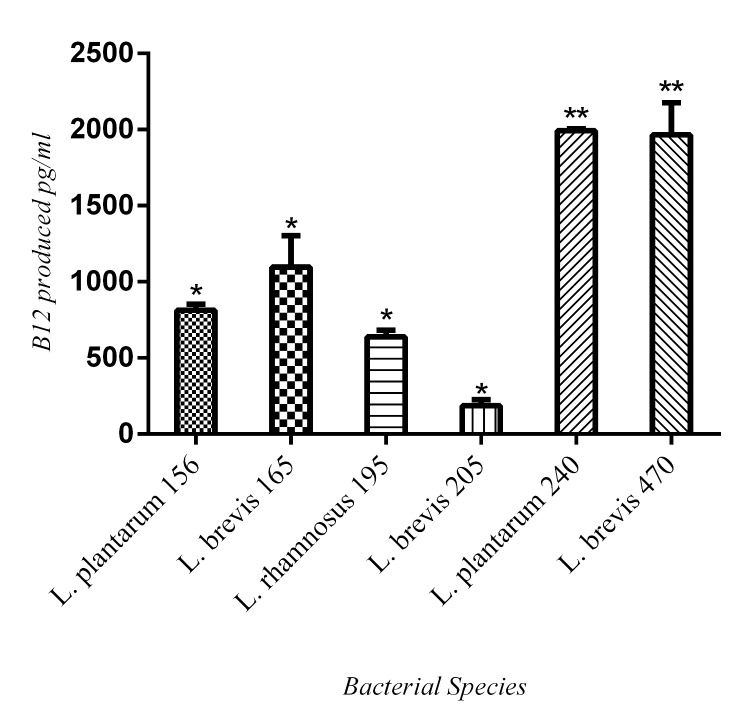
Fig 4. B12 vitamin production by 6 different Lactobacillus sp.
The results are reported as the mean ± SD of triplicate samples. Arrow indicates standard deviation and means comparison was done with unpaired t-test. * indicates statistically significant production of vitamin B12 by the isolates in comparison with the negative control samples (p<0.05). ** indicates highly significant vitamin B12 production in comparison with other 4 positive isolates (p<0.001).

