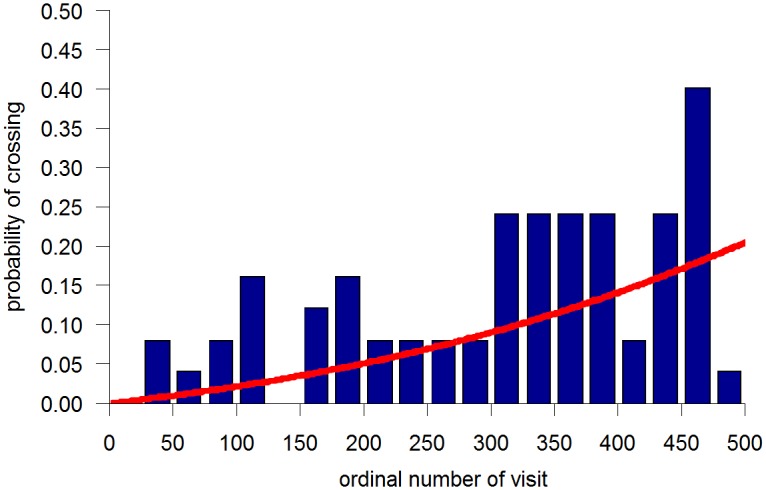
Fig 3. The percentage of doorway crossing per bins of 20 visits to doorway area with a logistic regression plotted on top of it, in a selected fly.

Note the increase in the likelihood of cutting through across the session.

Note the increase in the likelihood of cutting through across the session.