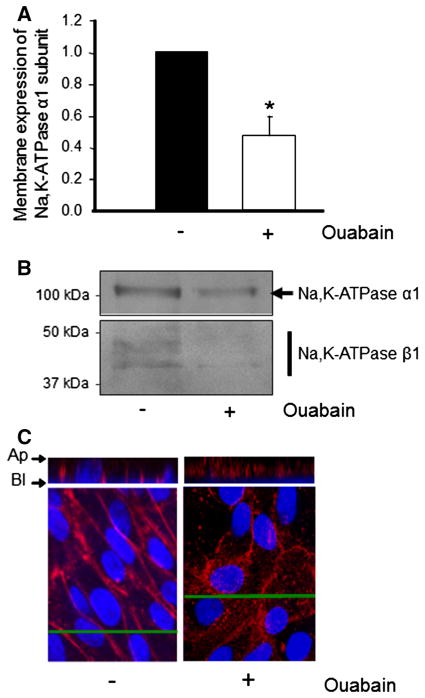
Fig. 8.
Ouabain effects on membrane expression of Na,K-ATPase in ADPKD cells. a Immunoblot analysis of the α1 subunit of Na,K-ATPase in ADPKD plasma membrane samples, obtained after cell biotinylation and precipitation with streptavidin. Expression levels of Na,K-ATPase α1 was determined by densitometric analysis of immunoblots labeled with an anti-Na,K-ATPase α1-specific antibody. Bars represent the mean ± SEM of three determinations performed on cells obtained from different ADPKD kidneys, with (*) indicating P < 0.01 versus untreated control. b Immunoblot analysis of the plasma membrane expression levels of both Na,K-ATPase α1 and β1 subunits in ADPKD cells, either untreated or treated with 3 nM ouabain for 24 h. Proteins were determined on samples obtained from the cells after biotinylation and streptavidin precipitation. c Immunofluorescence microscopy of confluent cultures grown on filter supports treated in the absence or presence of ouabain for 24 h and labeled for the α1 subunit of Na,K-ATPase. Top panels show z-line views positioned at the lines indicated in the x–y views shown in the bottom panels. Ap apical, Bl basolateral side of the cells

