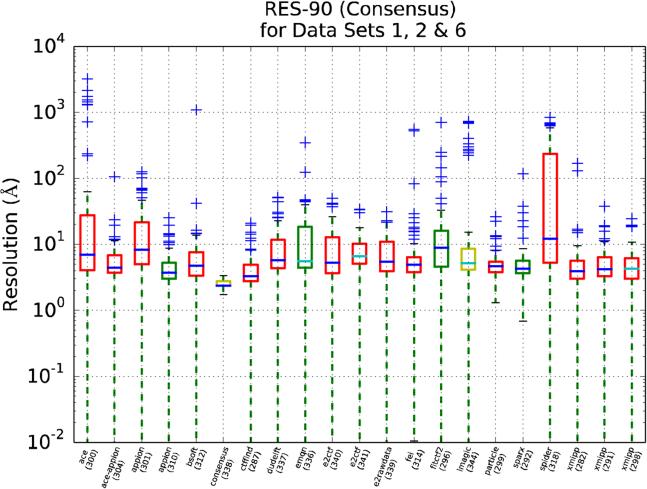
Figure 10.
RES-90 as a function of the package used in the upload. This plot only uses data sets 1, 2 and 6 which are the ones with larger discrepancies (the upload id number is provided in parenthesis). The box color is related to the participant's own stated level of expertise, with red being the highest, yellow intermediate and green the lowest. The median is colored dark blue for those uploads that have estimated all the CTFs and cyan otherwise.

