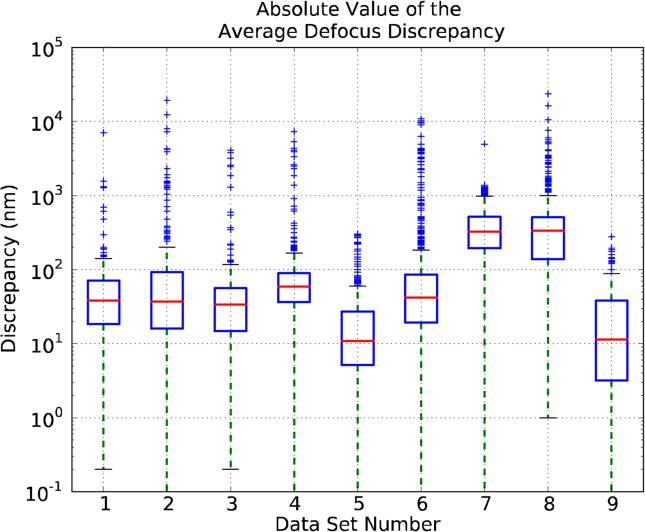
Figure 3.
Comparison of the Average Defocus estimated by the data providers with respect to the one estimated by the participants. X-axis ticks refer to data sets. The bottom and top of the box mark the first (25% of the data) and third quartiles (75% of the data), and the line inside the box marks the second quartile (the median). For a precise definition of Average Defocus Discrepancy, see Appendix B.

