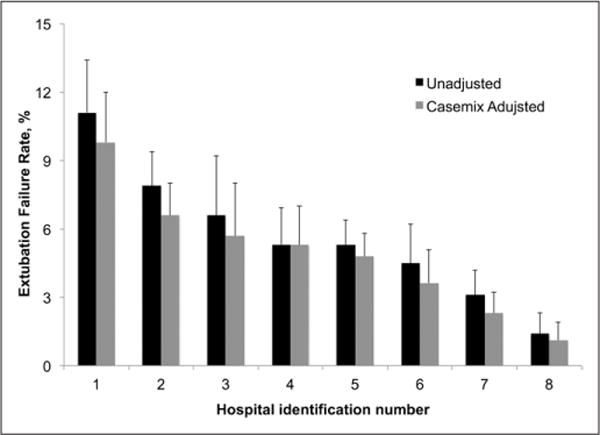
Figure 2.

Extubation failure rates by center. Values are expressed as the percentage of ventilation episodes ending in extubation failure at a hospital. Dark bars represent the unadjusted rates, and the light bars represent the rates adjusted for patient factors (neonate, surgical complexity, and airway anomalies).
