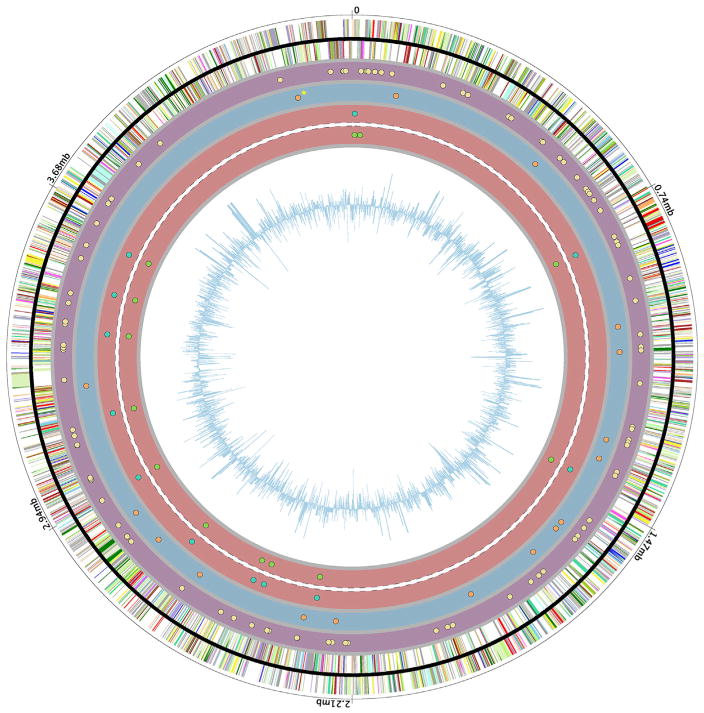
Figure 3.
Circular diagram of polymorphisms unique to the Guatemalan micro-outbreak strains plotted on the H37Rv reference genome. The outer wheel displays base pair coordinates. The second and third wheels represent positive- and negative-strand genes, respectively. Circles four through seven display genome positions of the 125 polymorphisms that separate the Guatemalan outbreak isolates from their nearest neighbor (8662-05) on the tree. The purple shaded wheel with yellow dots displays the 94 SNPs shared among all three isolates. The blue shaded wheel with orange dots displays the 18 SNPs specifically found in GG-131–11 (star denotes presence of two SNPs that are too close to resolve on the diagram). The red wheels display SNPs found in the jail-associated isolates GG-219-11 (outer, blue dots) and GG-152-12 (inner, green dots). The innermost circle represents GC-skew.

