Figure 1.

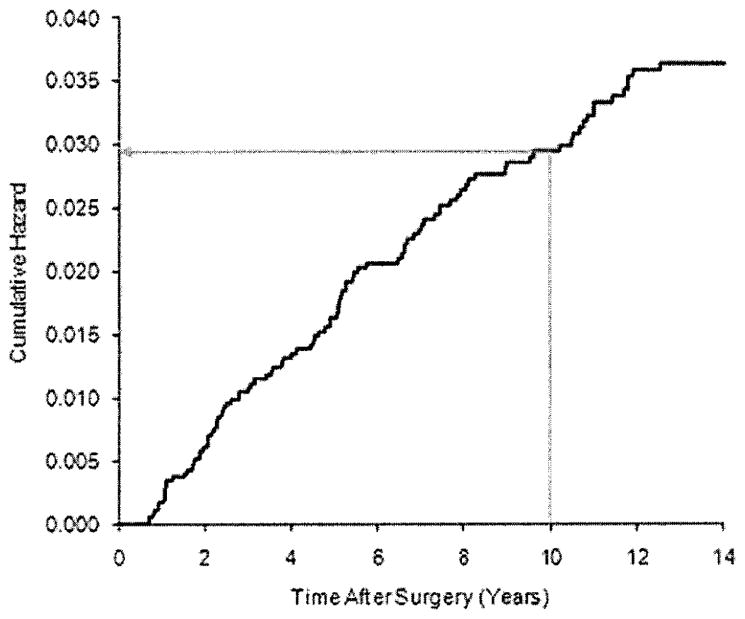
Baseline cumulative hazard estimate for NSABP B-14. The black line is the Breslow baseline hazard function estimate. The arrow shows the estimated cumulative hazard at 10 years.

Baseline cumulative hazard estimate for NSABP B-14. The black line is the Breslow baseline hazard function estimate. The arrow shows the estimated cumulative hazard at 10 years.