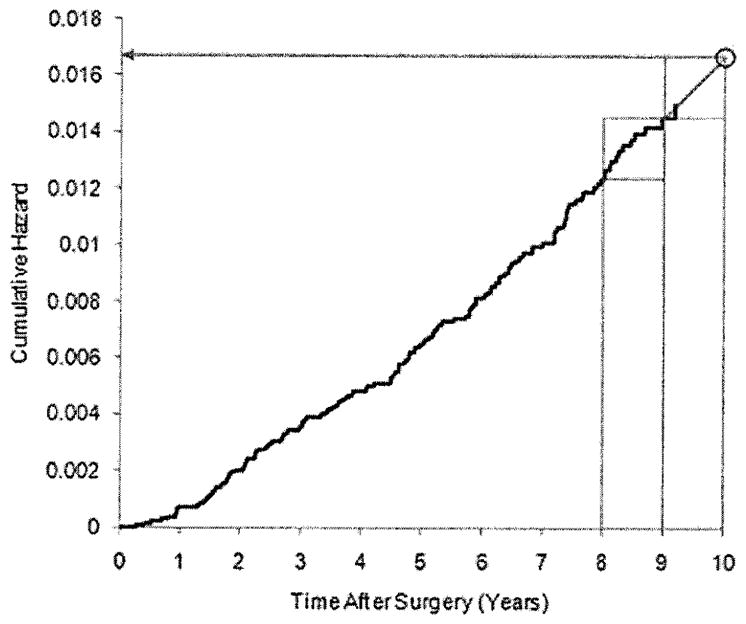
Figure 2.

Baseline cumulative hazard estimate for TransATAC. The black line is the Breslow baseline hazard function estimate. The two rectangles in the upper right corner are of identical dimension. The arrow shows the martingale extension estimate of the cumulative hazard at 10 years.
