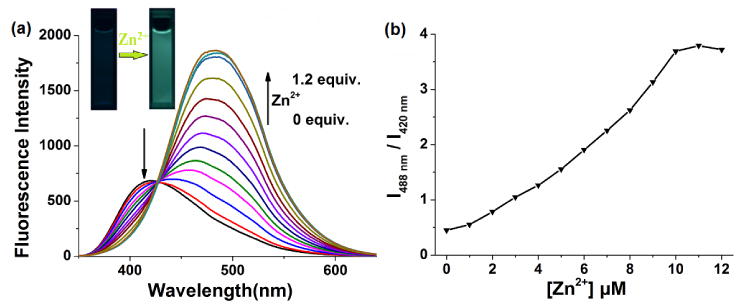
Fig. 1.

(a) Emission spectra of Mito-MPVQ (10 μM) with the excitation at 330 nm upon titration with Zn2+ (0, 0.1, 0.2, 0.3, 0.4, 0.5, 0.6, 0.7, 0.8, 0.9, 1.0 and 1.2 equiv.) in the methanol-water solutions (1:1, v/v, 50mM PBS buffer, pH=7.4); (b) ratiometric calibration curve between 420 and 488 nm (I488 nm/I420 nm) as a function of Zn2+ concentration.
