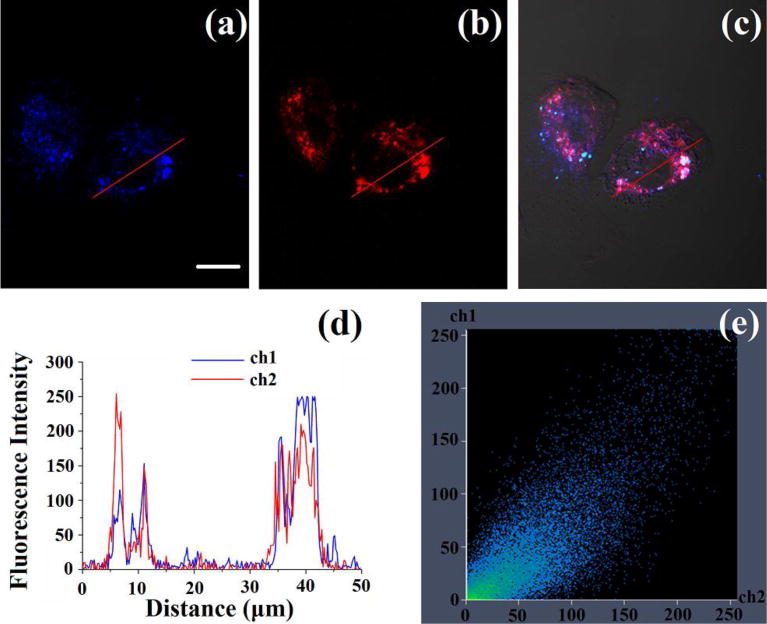
Fig. 4.

(a–c) Confocal fluorescence images of CHO cells. The cells were incubated with Mito-MPVQ (10 μM) and Mito Tracker Red (0.5μM) for 30 min. (a) Two-photon image of CHO cells, emission from the blue channel, λex = 720 nm, λem = 400–450 nm; (b) one-photon image of CHO cells, emission from the red channel, λex = 579 nm, λem = 590 nm; (c) merged image of (a), (b) and bright-field image. (d) Intensity profile of ROIs across CHO cells. Red lines represent the intensity of Mito Tracker Red and green lines represent the intensity of Mito-MPVQ. (e) Correlation plot of Mito Tracker Red and Mito-MPVQ (0.87). Magnification: 40; scale bar: 20 μm.
