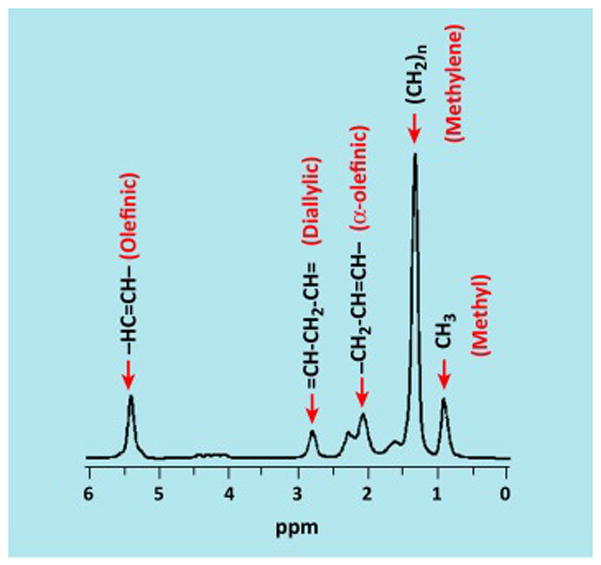
Figure 1. Representative proton spectrum of safflower oil showing triglyceride resonances.

The localized safflower oil proton spectrum acquired at 3 Tesla that shows multiple triglyceride resonances. The predominant methylene peak, corresponding to hydrogens in the CH2 moiety, is located at 1.3 ppm. Additional proton resonances related to triglyceride’s carbon backbone are also visible [36]. Illustration courtesy of Jürgen Machann, University Hospital Tübingen, Germany.
