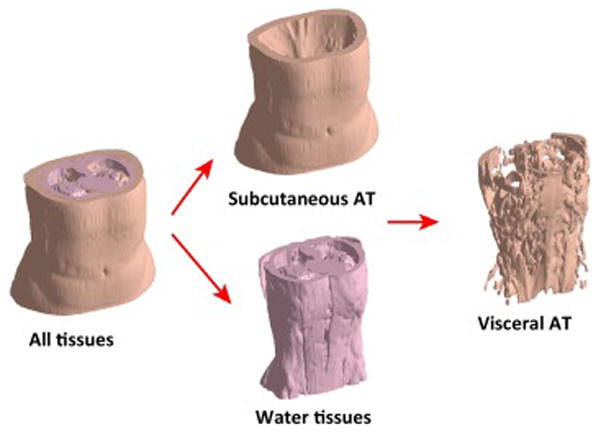
Figure 3. Fat-fraction abdominal adipose tissue images acquired from a woman with obesity.

Abdominal fat-fraction image from the dome of the liver to the femoral heads of a woman with obesity showing the total volumetric image and the three component images (water-containing lean tissues, SAT, and VAT+intermuscular adipose tissue) that were segmented using automated software [45]. The scan was completed using an investigational parallel MRI accelerated IDEAL sequence on a GE 3.0 Tesla MR750 scanner (GE Healthcare, Waukesha, WI) and a 32-coil torso array (Neo Coil, Pewaukee, WI). Illustration courtesy of Charles Mckenzie, Western University, London, Ontario, Canada.
