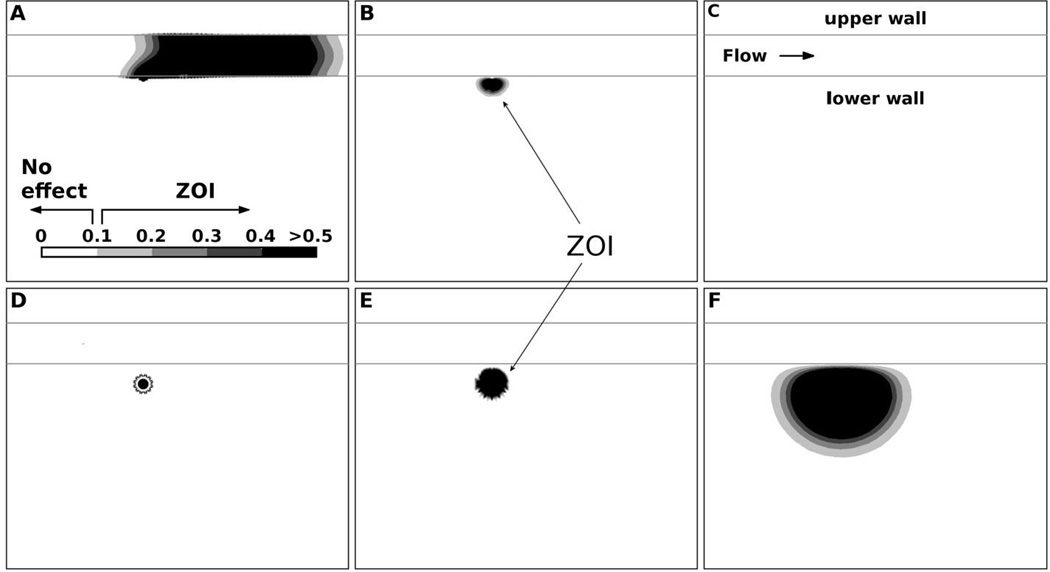
Figure 5.
Characteristic evolution of ZOI in microenvironment for the adhered (top row; A–C) and internalized (bottom row; D–F) drug vectors at the beginning (A,D), middle (B,E), and end of payload release (C,F). ZOI was evaluated by assuming the arbitrary concentration 0.0001 M, below which there is no therapeutic effect (the ‘no effect’ concentration); the concentration scale depicted in A has units of 10−3 M.

