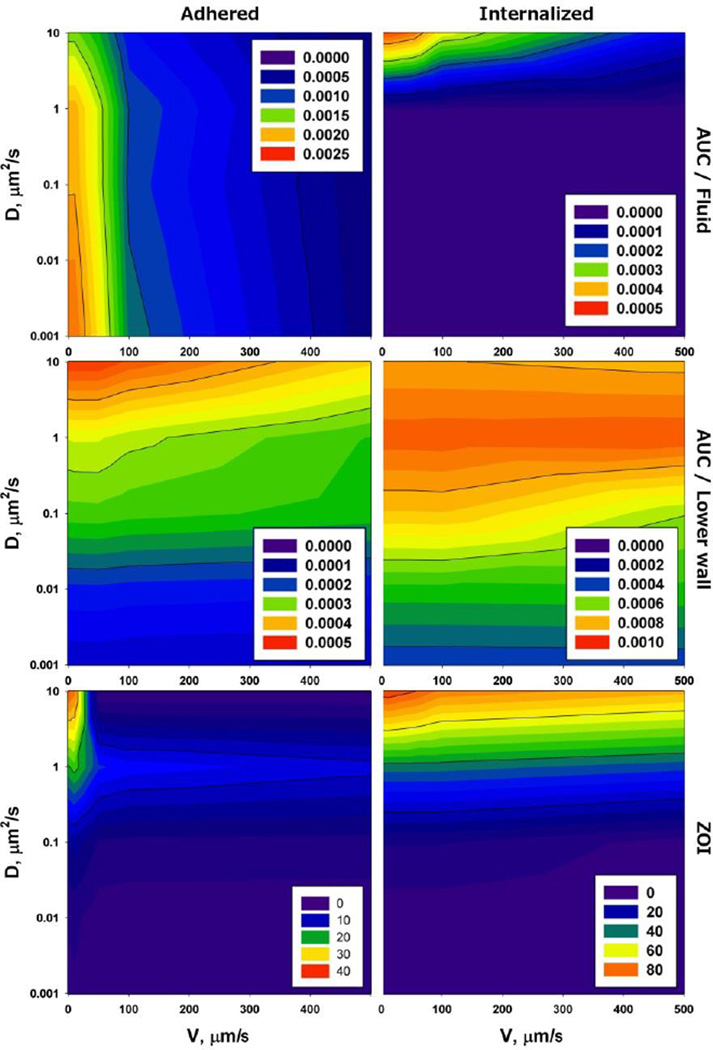
Figure 7.
AUC and ZOI in microenvironment and plasma in terms of payload diffusivity in tissue D and plasma flow velocity v for a drug vector adhering to vessel wall (left column) and internalized into vessel microenvironment (right column). The insets with number indicate AUC (top row – plasma; middle row - microenvironment) in M·s, and ZOI (bottom row) in µm2.

