Figure 2.
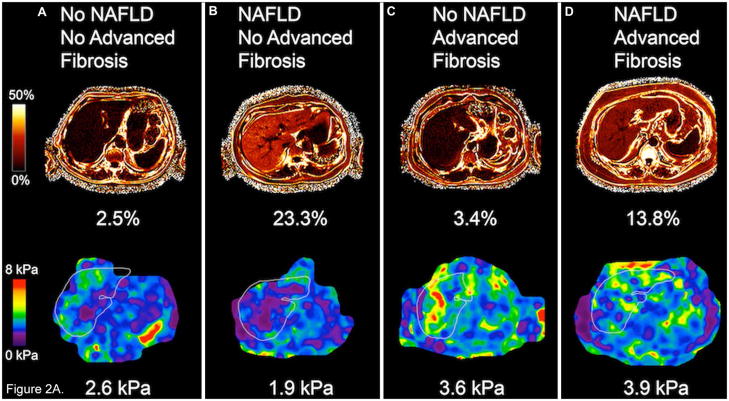
Figure 2A. Hepatic steatosis by MRI-PDFF (upper row) and liver stiffness by MRE (lower row) in 4 different patients. (A) Example of a patient with no NAFLD and no advanced fibrosis, (B) patient with NAFLD, but no advanced fibrosis, (C) patient without NAFLD, but with advanced fibrosis, and (D) patient with both NAFLD and advanced fibrosis. Fat fraction on MRI-PDFF was expressed in percentages and liver stiffness in kPa, shown underneath each image.
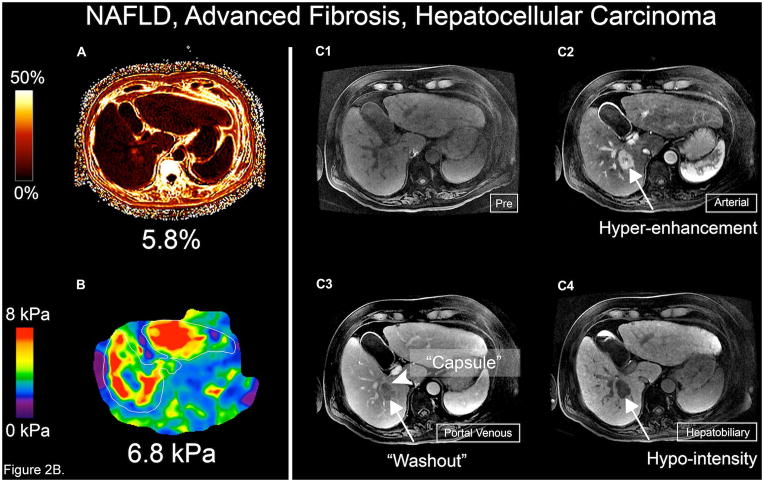
Figure 2B. MRI-PDFF, MRE, and Gadoxetic acid-enhanced 3T MRI of the patient with hepatocellular carcinoma. (A) MRI-PDFF shows 5.8 % hepatic steatosis, (B) MRE shows significant liver stiffness of 6.8 kPa, (C1) Pre-contrast 3D MRI image, (C2) Late arterial phase image shows 3-cm hyperenhancing lesion (arrow) in segment VI of the liver, (C3) Portal venous phase with definite “washout” (arrow) and “capsule” (arrowhead) of the lesion, typical features confirming the diagnosis of HCC; (C4) Hepatobiliary phase reveals markedly hypointense lesion (arrow)


