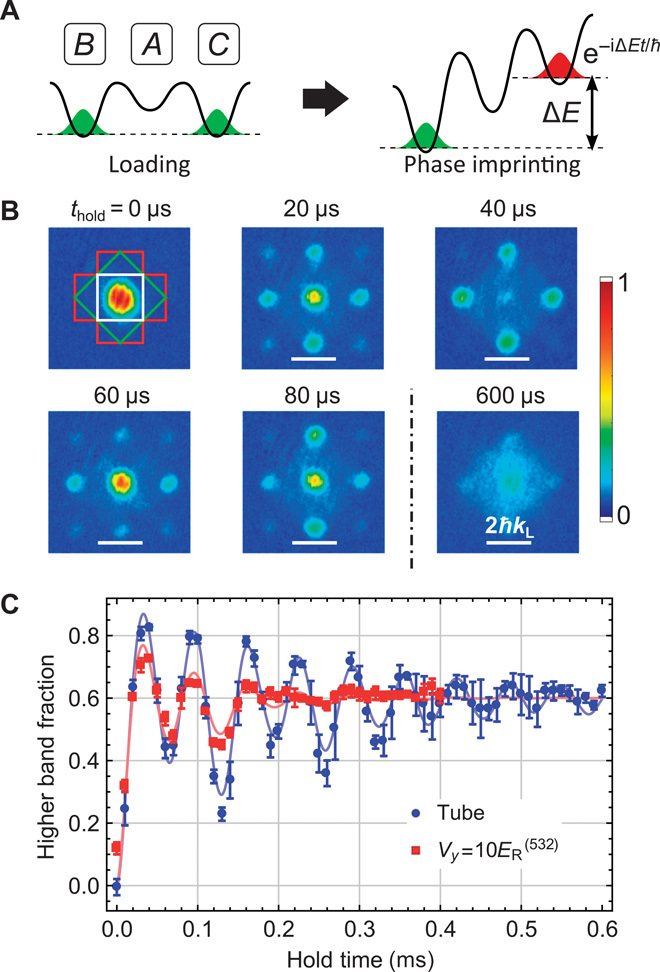
Fig. 2. Coherent band transfer.

(A) Principle of the transferring method. (B) Absorption images reveal the coherent oscillations between the |B〉 + |C〉 and |B〉 − |C〉 states. In the upper left image, the first three Brillouin zones are displayed by white, green, and red lines, respectively. (C) Oscillating behavior of the band population during phase imprinting in the absence of lattice confinement along the y direction (blue circles) and with lattice confinement −Vycos2(2kLy) (red squares). Solid lines are the fit results using the single-particle solution of the Schrödinger equations (see main text). Error bars denote SD of three independent measurements.
