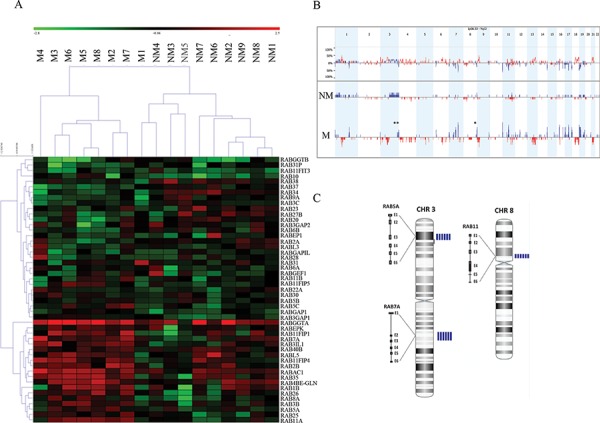
Figure 1. A. A representation of entire unsupervised cluster based on the copy number data of Rab genes according to clinical status (metastatic OSCC versus non-metastatic).

We observed that metastatic OSCC samples (M4, M3, M6, M5, M8, M2 and M7) had similar copy number gains of specific members of the RAB gene family. B. The frequency plot of copy number gains (blue) and losses (red) identified a large number of chromosomal imbalances in more than 80% of OSCC invasive cases. The highest scoring loci identified in this analysis were mapped to regions of recurrent copy number gain in metastatic OSCC, including 3p24-p22, 3q21.3 and 8p11–12. These regions correspond to RAB5, RAB7 and RAB11 respectively. C. Array CGH profile in chromosomes 3 and 8 showing an increased copy numbers (amplification) in the sequences for RAB5, RAB7 and RAB11. The blue vertical bars on the right to each chromosome represent the number of metastatic cases showing gained/amplified region per patient. M: metastatic group; NM: non-metastatic cases.
