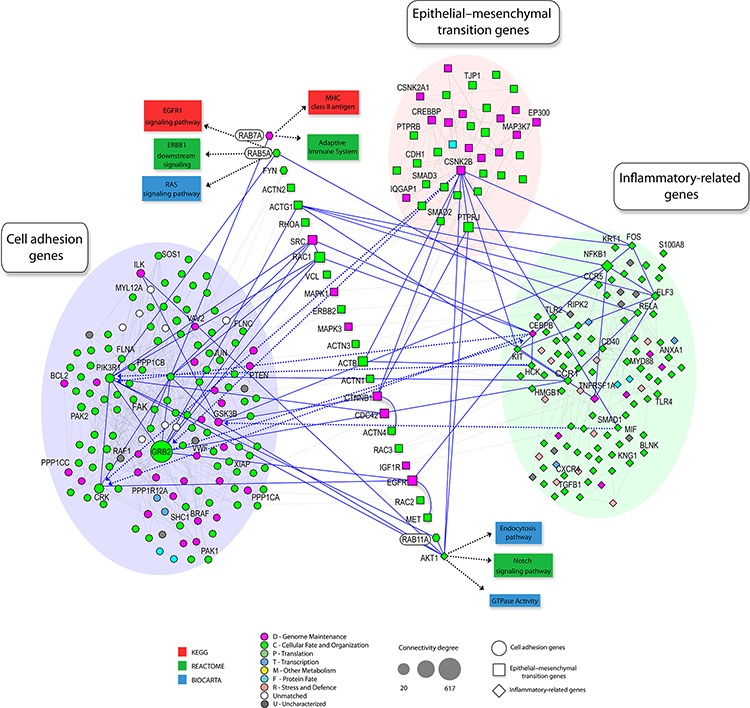
Figure 5. Schematic representation of protein–protein interaction network involving Rab GTPases.

Shown are protein–protein interaction networks from in NAViGaTOR using I2D and the Reactome, BioCarta and KEGG databases assessing functional interactions. High connectivity (k > 20 ) was highlighted by different shapes. GO term enrichment of proteins is rendered by node color. Node shapes indicate the involved process: cell adhesion genes (circle), epithelial-mesenchymal transition genes (square), inflammatory related-genes (diamond). Solid blue edges describe the interactions between well-described enriched genes in each assessed process and neighborhood. Enrichment of proteins involved in cell adhesion genes (blue circle), inflammatory related-genes (green circle) and epithelial-mesenchymal transition genes (pink circle) were observed (P < 0.01).
