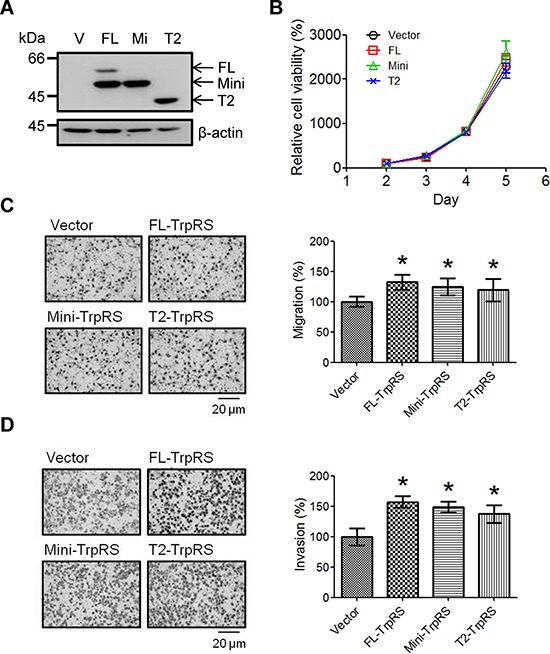
Figure 3. TrpRS overexpression promotes cell migration and invasion.

A. OEC-M1 cells were transfected with the pcDNA 3.1/Myc-His empty vector (V) or a pcDNA 3.1/Myc-His plasmid carrying one of three isoforms of TrpRS (FL: full-length TrpRS; Mi: mini-TrpRS; or T2: T2-TrpRS) as indicated. At 48 h after transfection, cell lysates were prepared, and the proteins were detected via Western blot using an anti-myc antibody. β-actin was used as the loading control. Simultaneously, transfected cells were subjected to cell counting, migration and invasion assays as described in the Materials and Methods section. B. Quantitative data show the relative percentage of cell viability obtained from three independent cell counting assays. The error bars indicate the standard error of the mean. Quantitative analysis of the migration C. and invasion assays D. Photographs obtained from the migration and invasion assays (left panel). The data are presented as values with standard deviations obtained from three independent experiments (right panel). *, a p value of less than 0.05 indicates significance based on the Mann-Whitney U test.
