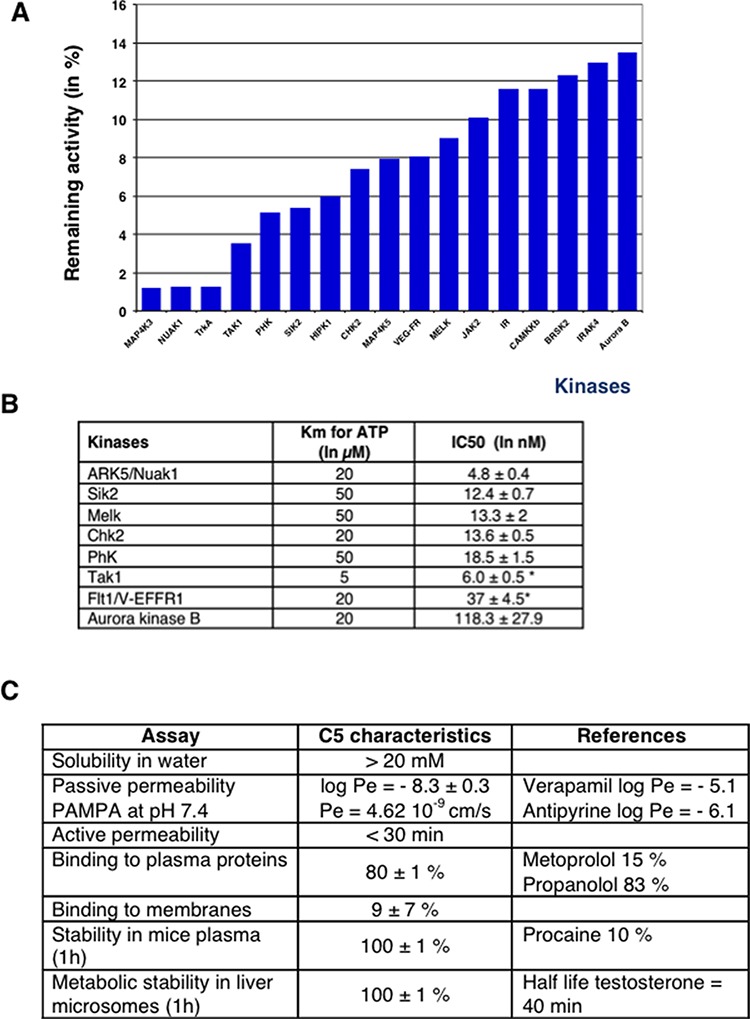
Figure 6. In vitro characterization of C5.

A profiling was realized against 138 kinases at the concentration of 250 nM. The best inhibitions are highlighted by the histograms A. IC50 determinations are reported in part B. Stars indicated that the IC50 were determined with an ATP concentration of 1 μM instead of the Km concentration. Pharmacokinetic characteristics are reported in C. and compared to approved drugs (indicated as references).
