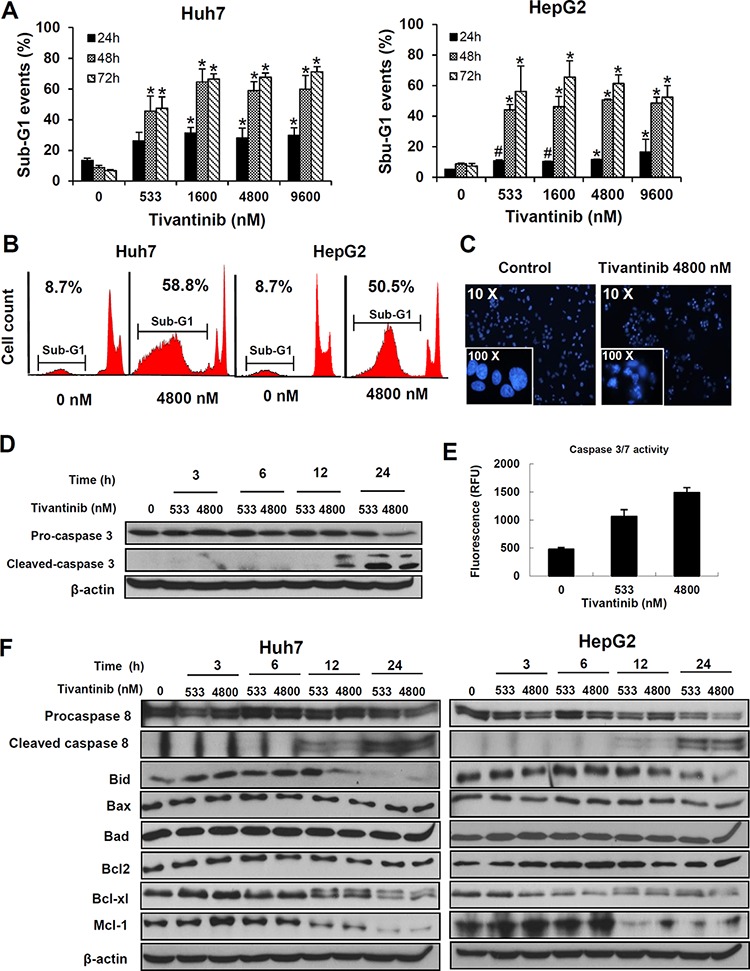
Figure 2. Tivantinib causes apoptosis by activating the mitochondrial apoptotic pathway.

A and B. Quantification (A) and typical FACS patterns (B) of apoptotic cells based on the count of the cell fraction showing subdyploid DNA content (sub-G1 fraction) after propidium iodide staining. *p < 0.01; #p < 0.05 in comparison to control treated cells. C. Fluorescence microscopy features after Hoechst staining showing typical chromatin condensation and nuclear fragmentation of Huh7 cells. D and E. Assessment of caspase 3 cleavage by western blot (D) and of caspase 3/7 activation as determined by fluorimetric assessment in HepG2 cells after 24 hours (E). F. Time kinetic of the expression of different regulators of apoptosis was performed by incubating Huh7 or HepG2 cell lines for the indicated time.
