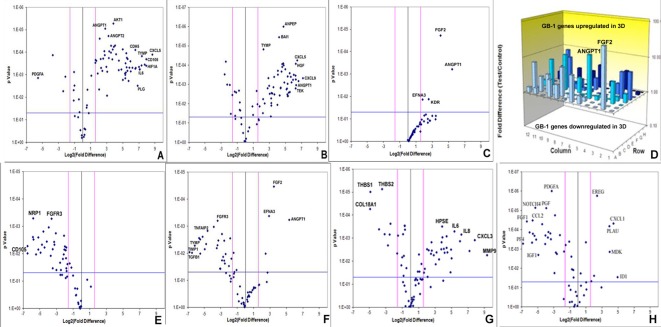
Figure 2. Brain tumor-derived angiogenic expression is upregulated in RCCS culture in vitro.
Volcano plots of angiogenesis array quantitative RT-PCR with a log2 fold difference on x-axis and p-value on y-axis. Horizontal blue line represents a p-value of 0.05 and vertical pink lines represent a fold change of +/− three. A.–C. Angiogenic gene expression between 2D and 3D glioma cultures of KNS42, U87 and GB-1 respectively. D. Box plot representation of volcano plot from C., comparing gene expression of GB-1 3D versus 2D expression, illustrating significant upregulation of FGF2 and ANGPT1 genes in 3D culture. Each bar represents one of 84 angiogenic genes. E.–F. Angiogenic gene expression in GB-1 2D and 3D cultures respectively, relative to the HGG primary tumor from which the cell line was derived. G. Differential angiogenic gene expression in primary GBM explant tissue relative to the 2D monolayer line T7 / 11 derived from this explant. H. Differential angiogenic expression between KNS42 / HBMEC heterogeneous aggregates and KNS42 tumor-only aggregates. For all experiments, each dot represents the mean gene expression of one gene assayed in three independent RNA samples from three different 3D aggregates, with selected genes of interest identified on plots. Each experimental condition (e.g. 3D or 2D), is presented relative to each other.

