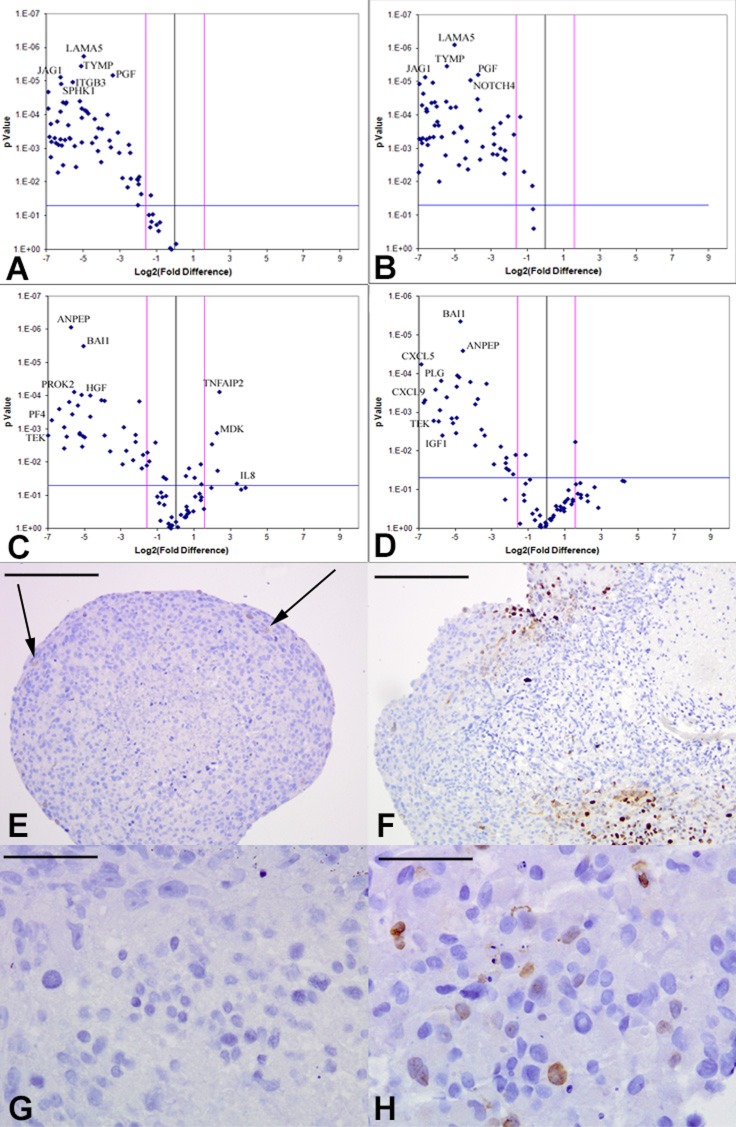
Figure 5. Downregulation of tumor-derived angiogenic response upon VEGF or FGFR inhibition in vitro.
Volcano plots of angiogenesis array quantitative RT-PCR with a log2 fold difference on x-axis and p-value on y-axis. Horizontal blue line represents a p-value of 0.05 and vertical pink lines represent a fold change of +/− three. Each dot represents the mean gene expression of one gene assayed in three independent RNA samples from three different 3D aggregates, with selected genes identified on plots. A.–B. KNS42 aggregates treated with the CBO-P11 VEGF inhibitor or PD16686 FGFR inhibitor respectively, relative to untreated KNS42 aggregates, showing significant downregulation of many angiogenesis-related genes in treated cells. C.–D. U87 aggregates treated with CBO-P11 and PD166866 relative to untreated U87 aggregates respectively, showing significant downregulation of many genes in treated aggregates. Angiogenic gene expression depicted represents the mean of three independent experiments each run using triplicate arrays. E. Low levels of active proliferation within KNS42 aggregates treated with PD16686, with 4% +/− 0.6 of Ki67 positive cells. F. Localized patches of actively proliferating areas within KNS42 aggregates treated with CBO-P11, with 18% +/− 2.3 of Ki67 positive cells. G. No Ki67 expression in any cells within U87 aggregates treated with PD16686 (0% +/− 0.0 of Ki67 positive cells). H. Sporadic expression of Ki67 within KNS42 aggregates treated with CBO-P11, with 8% +/− 2.9 of Ki67 positive cells. Cells were counted from three independent aggregates and using either a whole aggregate field of view or three different field of views for each aggregate. The mean +/− SEM proportion of Ki67 positive cells relative to total number of cells is given and representative images shown. Scale bar E-F = 200μm; G-H = 25μm

