
Figure 2. Time-dependent ROC curves for the prognosis of breast cancer by the STMN1-E/P model and Kaplan-Meier survivals in the training and validation sets.
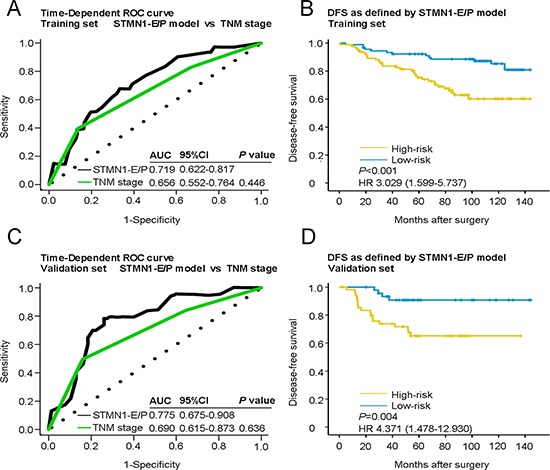
Data are shown as AUC (95% CI) or hazard ratios (95% CI). ROC = receiver operator characteristic. AUC = area under the curve. A. Comparisons of the prognostic accuracy by the STMN1-E/P model and TNM stage in the training set. B. DFS of patients with high- or low-risk scores in the training set. C. Comparisons of the prognostic accuracy by the STMN1-E/P model and TNM stage in the validation set. D. DFS of patients with high- or low-risk scores in the validation set. P values were calculated using the log-rank test.