
Figure 2. Co-overexpression of all five OPN isoforms in individual primary EACs.
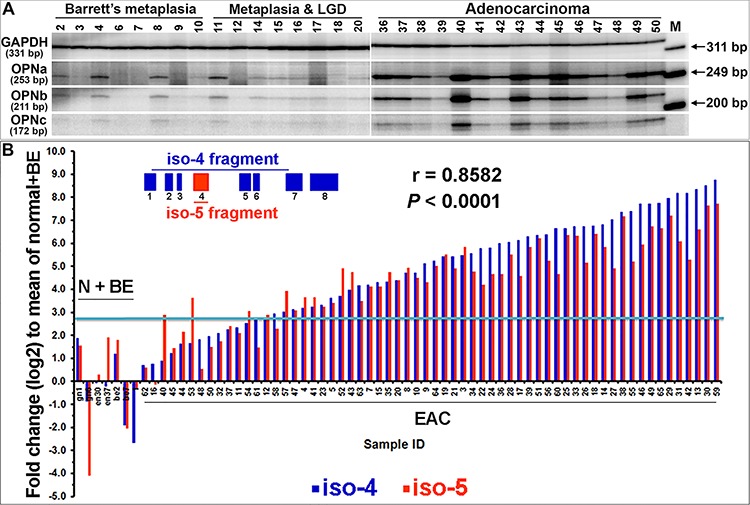
A. OPN isoforms a, b and c were co-overexpressed in EACs. Quantitative RT-PCR with a pair of primers flanking the SPP1/OPN exons 5 and 6 and a pair of primers for GAPDH were co-amplified in a single-tube reaction using [γ-32P]-ATP labeling. Isoform fragments of OPNa (253 bp), b (211 bp) and c (172 bp), along with GAPDH (331 bp) were resolved by PAGE. B. Two sets of qRT-PCR analyses of OPN isoform 5-specific expression (primers located within exon 4) and OPN isoform 4 expression (size selection with primers crossing exons 1 to 7) were performed and a significant correlation was observed. The blue line indicates a 2-fold plus one standard deviation change as compared to the mean of normal and Barrett's metaplasia combined. (N, normal; BE, Barrett's esophagus)