
Figure 2. Cellular uptake.
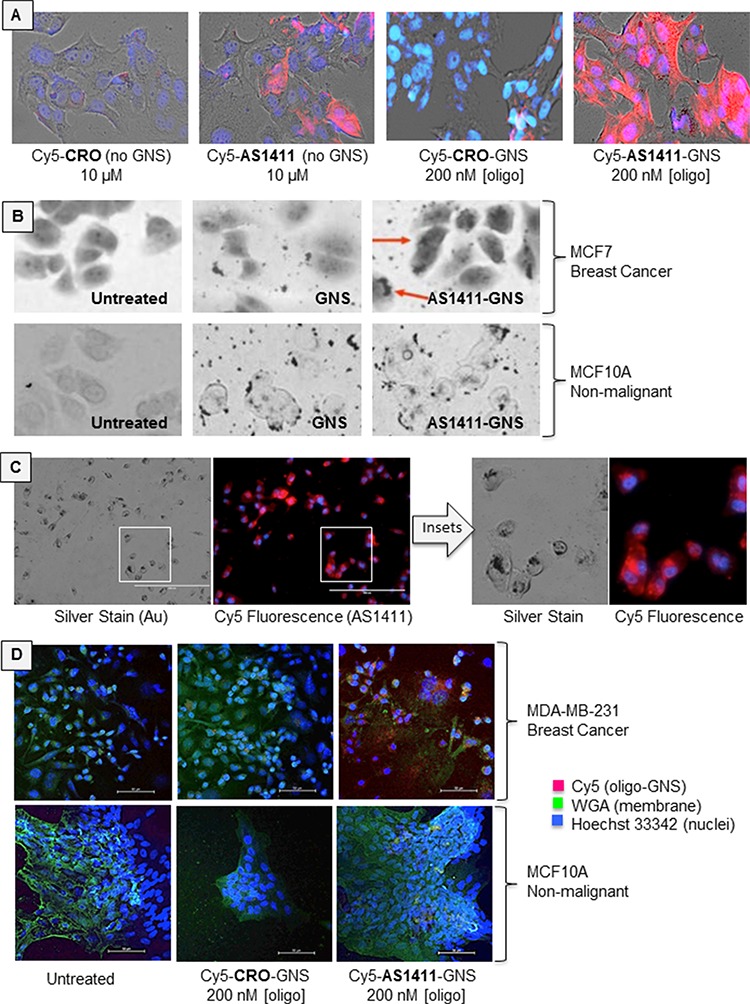
A. MCF7 breast cancer cells were incubated with fluorescent Cy5-linked oligonucleotides (AS1411 aptamer or CRO control), or with Cy5-oligonucleotides attached to 5 nm GNS. Micrographs show brightfield images overlaid with Cy5 fluorescence (red) and DAPI staining (cell nuclei, blue) after 72 h incubation. B. Silver-enhanced staining in MCF7 breast cancer cells and MCF10A non-malignant breast epithelial cells. Note that GNS accumulate in the perinuclear region of MCF7 cancer cells (red arrows) only when attached to AS1411, whereas MCF10A non-malignant cells display surface binding of GNS and AS1411-GNS, but very little internalization. C. Comparison of silver staining and Cy5 fluorescence in the same sample of MCF7 cells, indicating substantial co-localization. D. MDA-MB-231 breast cancer cells and MCF10A cells assessed by confocal microscopy. Micrographs show overlay of Cy5 fluorescence (red), nuclear stain (blue) and WGA stain (green).