
Figure 2. NK92 cells mediated no/low cytotoxicity or no/low secretion of IFN-γ when compared to primary NK cells.
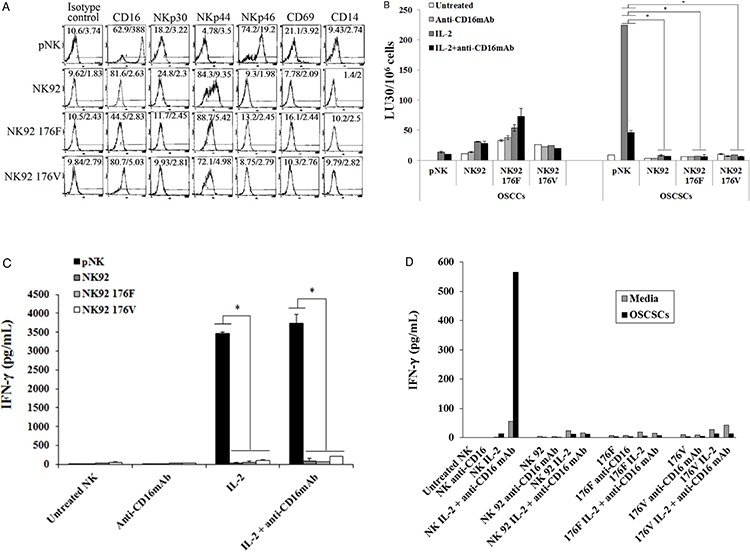

The surface expression of CD16, NKp30, NKp44, NKp46, CD69 and CD14 on primary donor derived NK cells or NK92 parental line and its CD16 high (176V) and low (176F) variant transfectants were assessed after staining with the PE conjugated antibodies and analyzed using flow cytometry. Isotype control antibodies were used as controls. The numbers on the right hand corner are the percentages and the mean channel fluorescence intensities for each histogram A. NK cells or NK92 parental cells with its transfectants (1 × 10⁶ cells/ml) were left untreated or treated with anti-CD16mAb (3 μg/ml), IL-2 (1000 units/ml), or a combination of IL-2 (1000 units/ml) and anti-CD16 antibody (3 μg/ml) for 18–24 hrs. After which primary human NK cells and NK92 cells were added to 51Cr labeled OSCCs or OSCSCs at different E:T ratios. NK cell cytotoxicity was determined using a standard 4 hour 51Cr release assay and the lytic units 30/106 cells were determined using inverse number of NK cells required to lyse 30% of the target cells × 100. Minimum one of five representative experiments is shown in this figure. *The differences between IL-2 or IL-2+anti- CD16mAb treated primary NK cells and those mediated by IL-2 or IL-2+anti-CD16mAb treated NK92 cells or its transfectants is significant at p < 0.05 B. Primary NK cells (1×10⁵/ml) and those of NK92 cells (1×10⁵/ml) and its transfectants were activated as described in Figure 2B, and after overnight incubation the supernatants were collected and the levels of IFN-γ were determined using specific ELISA. Minimum one of eight representative experiments is shown. *The differences between IL-2 or IL-2+anti-CD16mAb treated primary NK cells and those of IL-2 or IL-2+anti-CD16mAb treated NK92 cells or its transfectants is significant at p < 0.05 C. Highly purified primary NK cells (1×10⁵/ml) and NK92 cells (1×10⁵/ml) and its CD16 transfectants (1×10⁵/ml) were treated as described in Figure 2B and cultured without and with OSCSCs at an effector to target ratio of 0.5 to 1 for 24 hours. Afterwards, the supernatants were removed from the co-cultures and the levels of IFN-γ D. TNF-α E. GM-CSF F. IL-6 G. and IL-10 H. were determined by multiplexed Luminex analysis. One of three representative experiments is shown in this figure.