
Figure 4. Immunofluorescence confocal microscopy: colocalization of cystatin F with LysoTracker, and cathepsin C and H in NK92 cells.
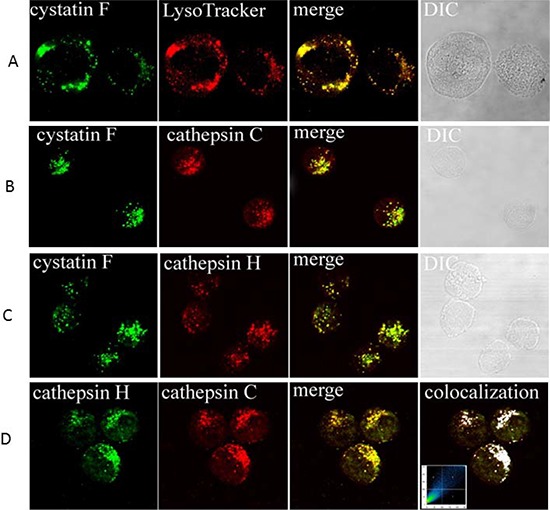
Colocalization of cystatin F with LysoTracker A. colocalization of cystatin F with cathepsin C B. colocalization of cystatin F with cathepsin H C. and colocalization of cathepsins C and H D. are shown. Samples were labelled with primary antibodies as indicated on micrographs: anti-cystatin F pAb (A, B, C), anti-cathepsin C pAb (B, D), anti-cathepsin H mAb. Red color in (A) originates from labeling with LysoTracker. Green color originates from Alexa Fluor 488-labelled secondary antibodies. Red color in (B, C and D) originates from Alexa Fluor 555-labelled secondary antibodies. Before merging the confocal images, signals for red and green fluorescence were adjusted to comparable levels. The yellow color indicates co-localization of two labelled antigens for cystatin F and LysoTracker (A), cystatin F with cathepsin C (B), and cystatin F with cathepsin H (C), and cathepsins C with cathepsin H (D) Differential interference contrast (DIC) images are shown. In (D), right image, the colocalization of both cathepsins is represented by the pixels above the threshold in both channels on the contour plot and on the merged image (white color). The relative colocalization areas, as presented by pixels in the third quadrant of the image, were higher than 40% for all co-localized pairs.