
Figure 2. Unequal amplification of transcripts corresponding to NANOG1 and its pseudogenes by PCR.
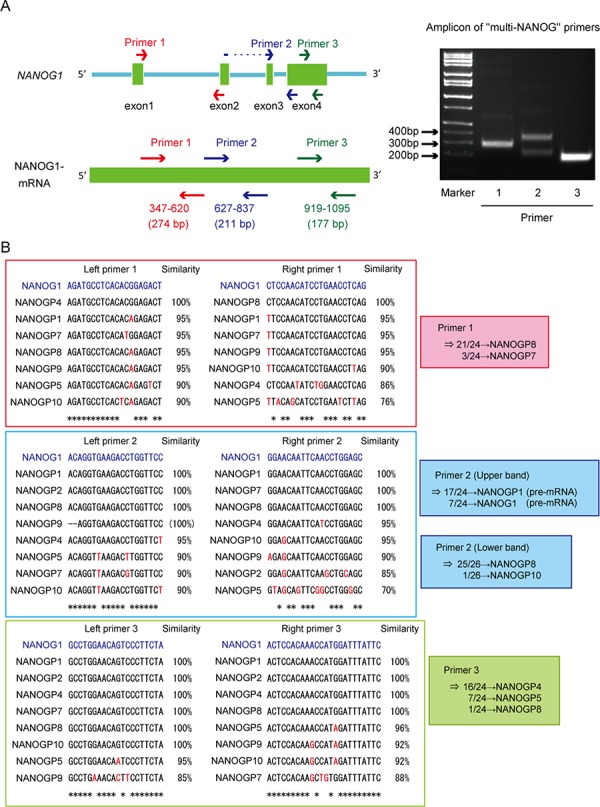
A. Left panel: Schematic representation of the NANOG1 gene (top) and NANOG1 mRNA (bottom). Arrows indicate “multi-NANOG” primer positions. DU145 cDNA was amplified using each “multi-NANOG” primer set. Right panel: Amplicons were separated in the depicted agarose gel. B. Left panels: Multiple sequence alignments of NANOG1 and its pseudogenes. Primer sequences are presented in blue at the top of each panel, and base differences between NANOG1 and its pseudogenes are indicated in red. PCR products generated using each “multi-NANOG” primer set were cloned into plasmids, and their sequences were analyzed. Right panel: Results of sequence analyses.