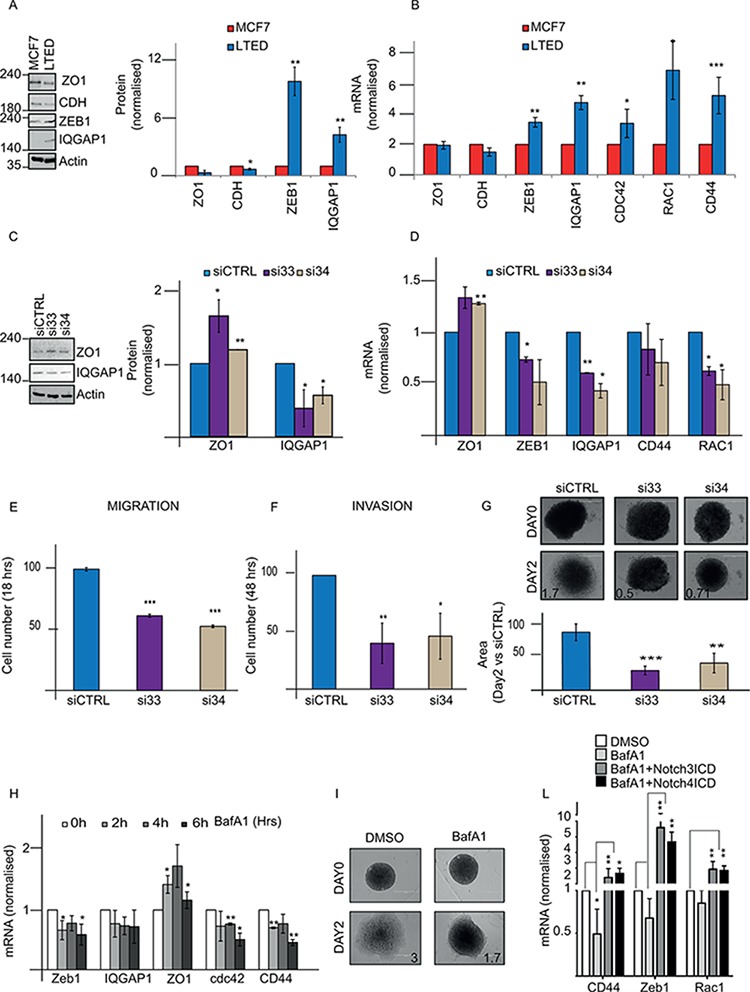
Figure 5. DMXL2 regulates mesenchymal switch in LTED cells.

A. Representative western blot showing EMT targets genes in LTED cells compared to MCF7 B. q(RT) PCR mRNA levels of EMT targets normalised to 28S C. Representative western blot showing regulation of EMT genes following DMXL2 knock down D. q(RT) PCR mRNA of EMT genes after siDMXL2 E, F. Knock down was performed on 6 well plate for 24/48 hours. Cells were harvested and counted. 40,000 were seeded on 16 wells ECM plates with/without matrigel (for invasion and migration respectively) and left migrating or invading for 48/24 hours respectively. The graphs represent the difference in cell number compared to siControl G. 3D Invasion assay organoids. Representative pictures of organoids embedded in matrigel after 5 days knock down (performed during the hanging time) at day 0 and 2. The graph represents the difference in the area between day 0 (cells just embedded) and day 2 (cells left invading. Bars represent 400 uM. H. Bafilomycin A1 impairs cell invasion. Cells were treated as in 4C. qRT-PCR mRNA for EMT genes is shown. I. Representative pictures of organoids. Medium containing 500 pM BafA1 was added to the medium for 48 hours after embedding the organoids in matrigel. Day 0 and day 2 images are shown. L. EMT targets are rescued by ectopic expression of Notch ICD. Cells were pre-treated for 6 hrs with 500 pM of BafA1 followed by 24 hours Notch ICD over-expression. Every experiment is an average of three independent experiments. Bars represent standard deviation (*) P < 0.05 (**) P < 0.01 (***) P < 0.001.
