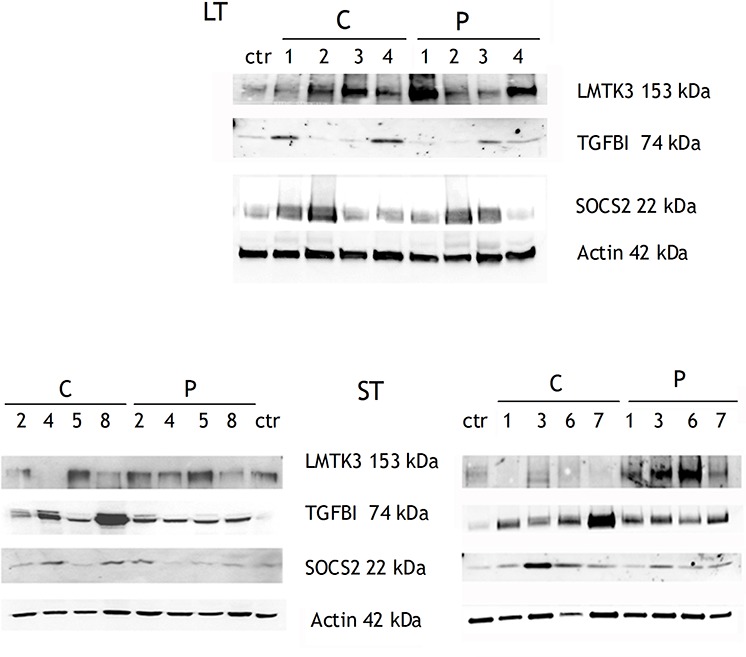
Figure 3. WB validation of three proteins whose mRNAs were overexpressed in C and P samples compared to healthy control.

The upper panel shows LT samples, whereas the lower panel shows ST samples. Among ST samples, ST2, ST4, ST5, ST8 (on the left) are the same samples already analyzed by SAGE; ST1, ST3, ST6, ST7 are additional ST samples.
