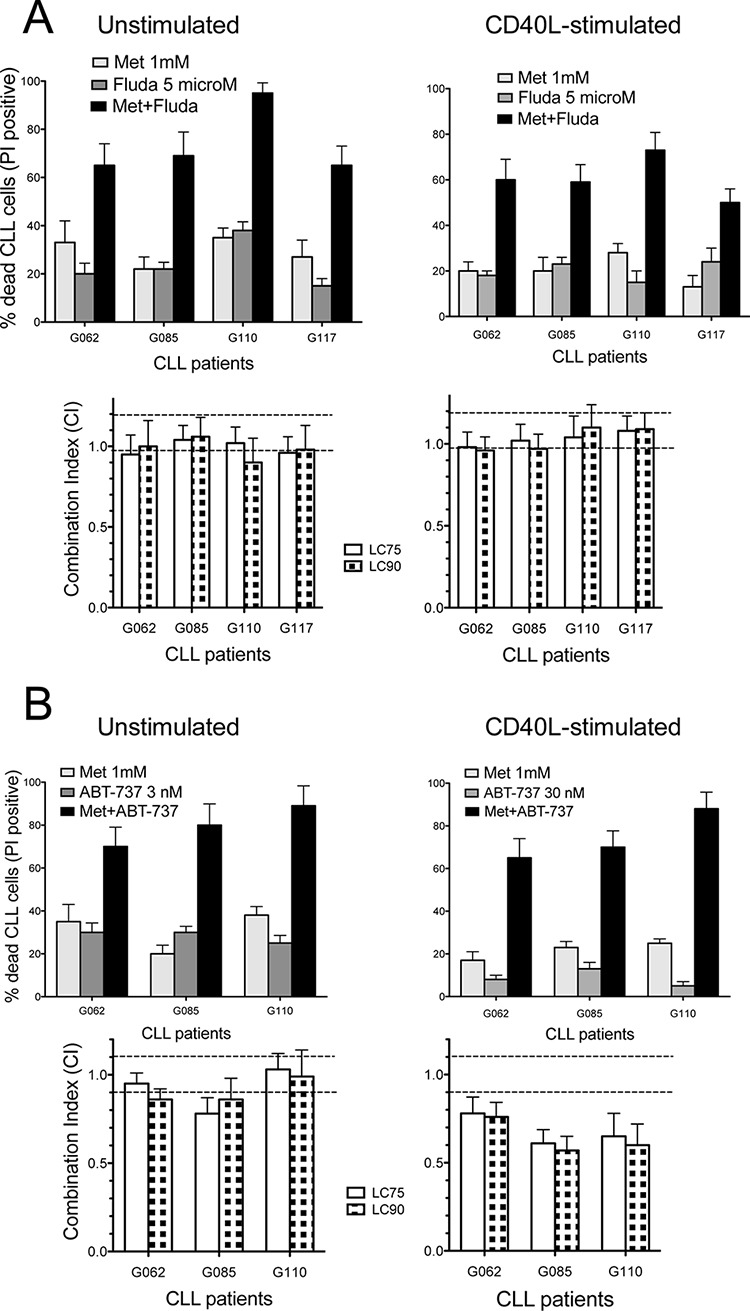
Figure 6. Combination cytotoxicity of metformin and Fludarabine or ABT-737.

A. Upper: metformin and/or Fludarabine cytotoxicity (48 h) in four CLL samples, resting or activated, expressed as % cells positive for PI uptake (spontaneous apoptosis subtracted). Lower: CI values (at LC75 and LC90, see Materials and Methods) calculated on dose-effect profiles obtained by treating cells with increasing concentrations of metformin (1–10 mM), Fludarabine (1–10 microM) or Met/Fludarabine at constant ratios. Dotted lines separate CI values indicating synergism (CI < 0.9), additive effect (0.9 ≤ CI ≤ 1.1) and antagonism (CI > 1.1). B. Upper: metformin and/or ABT-737 cytotoxicity (48 h) in three resting or activated CLL samples. Lower: CI values calculated on dose-effect profiles obtained treating cells with increasing concentrations of metformin (1–10 mM), ABT-737 (1–10 nM for resting CLLs, 10–100 nM for activated samples) or Met/ABT-737 at constant ratios.
