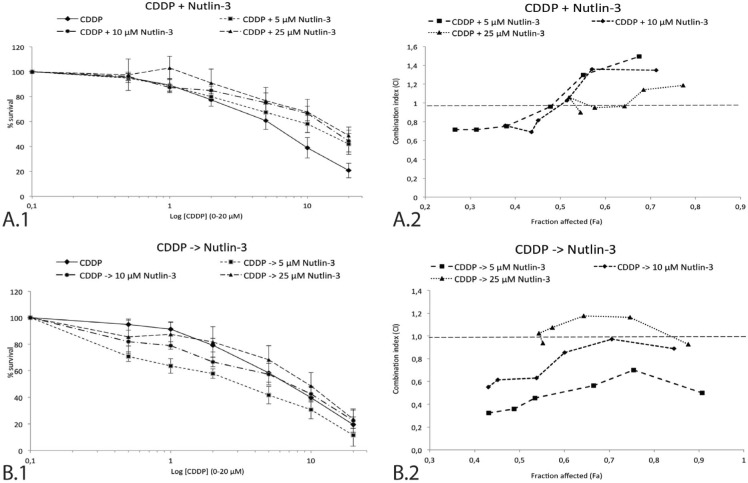
Figure 3. Survival curve and combination index (CI) of the sequential and simultaneous combination therapy in the p53 wild type cell line A549.
A. 1. Survival curve after 24 hours of CDDP (0-20 μM) monotherapy and in simultaneous combination with 5 μM, 10 μM, or 25 μM Nutlin-3. 2. The corresponding combination index for each Nutlin-3 concentration is shown in detail on the right. Each data point represents the corresponding CDDP concentration (0.5-1-2-5-10-20 μM). B. 1. Survival curve after 24 hours of CDDP (0-20 μM) monotherapy and sequential combination therapy with 5 μM, 10 μM, or 25 μM Nutlin-3. 2. The corresponding combination index for each Nutlin-3 concentration is shown in detail on the right. Each data point represents the corresponding CDDP concentration (0.5-1-2-5-10-20 μM). The supporting data for this figure (Mean IC50-values and mean CI) can be found in Table 1.

