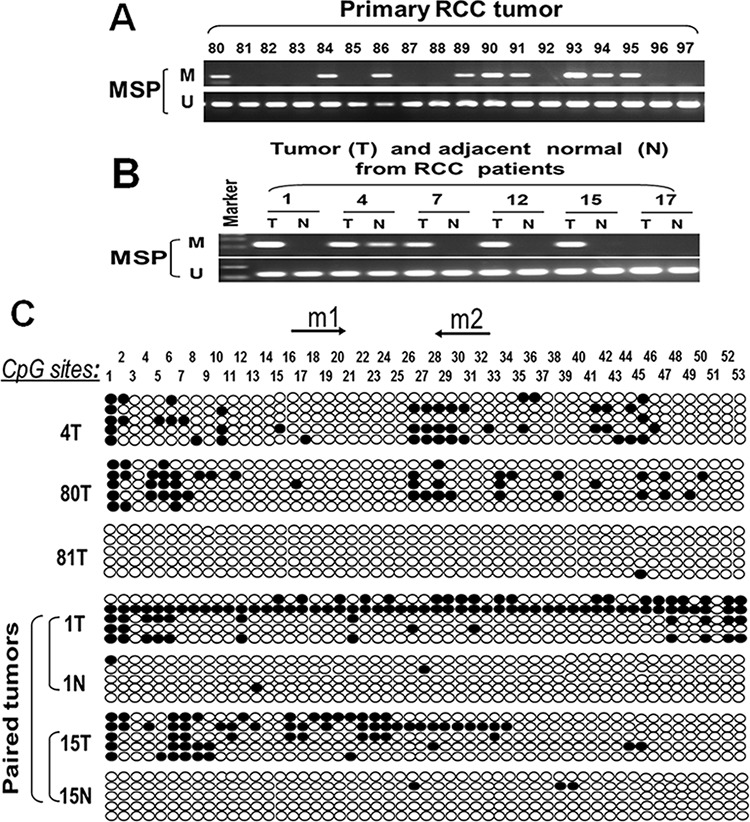
Figure 3. Representative MSP and BGS results.

A. ASC/TMS1 methylation in primary RCC. M, methylated; U, unmethylated. B. ASC/TMS1 methylation in paired RCC (T) and matched normal renal tissue (N) samples. C. Methylation status of ASC/TMS1 was confirmed by bisulfite genomic sequencing (BGS). Each row represents one bacterial clone with one circle symbolizing one CpG site. Filled ovals indicate methylated. Open ovals indicate unmethylated.
