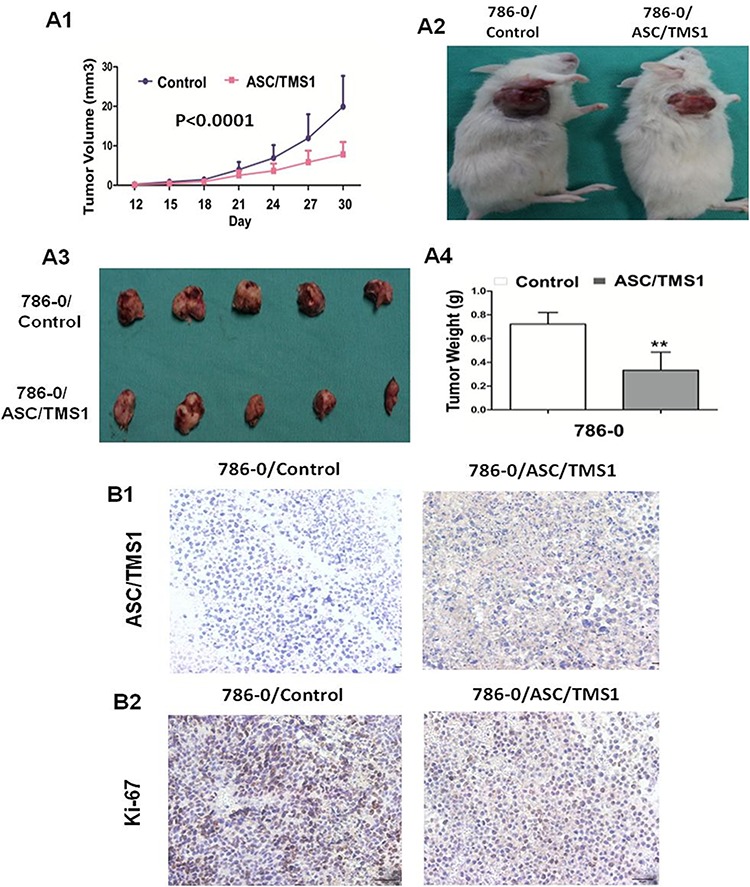
Figure 7. ASC/TMS1 inhibited growth of tumors derived from 786–0 in vivo.

A1. Subcutaneous tumor growth curve of ASC/TMS1-expressing 786–0 cells in SCID mice was compared with control empty vector transfected cells. A2. A representative picture of tumor growth in SCID mice subcutaneously inoculated with ASC/TMS1 or control vector. A3. Pictures of the isolated tumors from each mouse (n = 5/group). A4. Histogram represents mean of the tumor weight from the ASC/TMS1 and control vector groups. Data are mean ±SD. B1. Immunohistochemical staining of ASC/TMS1 in xenograft tumors in SCID mice. Brown cytoplasmic and nuclear signals indicate the ASC/TMS1 protein expression. B2. Representative ki-67 staining of xenografted tumor derived from 786–0 cells transfected with ASC/TMS1 or control vector. An decrease in the number of Ki-67-positive cells (brown-stained nuclei) is evident in ASC/TMS1-transfected tumors. **P < 0.01.
