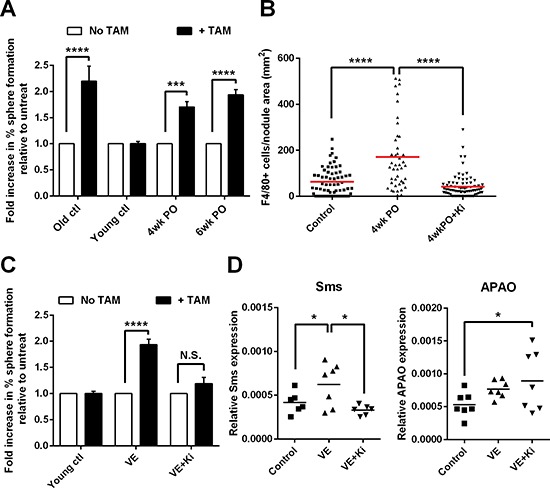
Figure 4. Surgery accelerates the emergence of macrophage-responsive tumor-initiating cells.

(A) Graph showing the fold-change in percentage of cells forming tumor spheres in the presence of TAMs, relative to without TAMs. Tumor cells from young mice (age 10–15 weeks) that underwent VE followed by recovery for 4–6wks were stimulated with TAMs derived from non-VE old mice (> 30wk). Bars represent mean ± SE; 2-way ANOVA, ***P < 0.001, ****P < 0.0001 (n = 3–4 mice). (B) Density of F4/80+ TAMs in primary relapsed tumors from mice that underwent VE followed by 4wks of recovery on a normal (4wkPO) or Ki20227-supplemented diet (4wkPO + Ki), and non-VE age-matched control mice. Each point represents one tumor nodule; 1-way ANOVA, ****P < 0.0001 (n = 3–7 mice). (C) Graph showing the fold-change in percentage of cells forming tumor spheres in the presence of TAMs, relative to without TAMs. Tumor cells from VE mice on normal (VE) or Ki20227 diet (VE+Ki) were stimulated with TAMs derived from non-VE old mice. Bars represent mean ± SE; 2-way ANOVA, ****P < 0.0001, N.S. not significant (n = 3–4 mice). (D) Graph showing the gene expression level of Sms (left panel) and APAO (right panel) in CD34− tumor cells derived from VE mice on normal (VE) or Ki20227 diet (VE+Ki) and non-VE age-matched control mice. Each point represents one mouse; 1-way ANOVA, *P < 0.05 (n = 6–7 mice).
