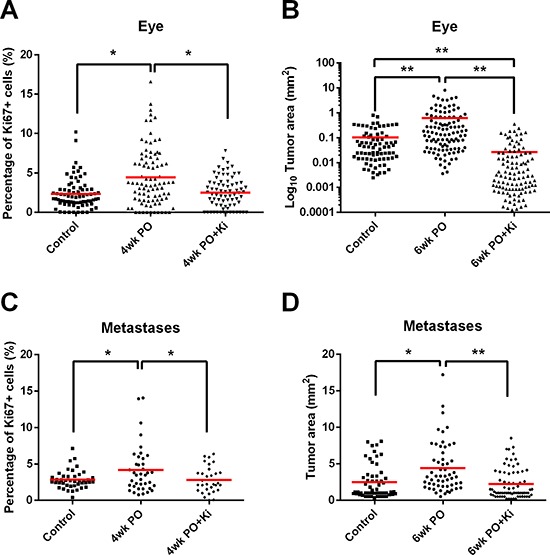
Figure 5. Macrophage depletion reduces tumor growth after surgery.

(A) Percentage of Ki67+ cells in relapsed eye tumors from VE mice on normal (VE) or Ki20227 diet (VE+Ki) compared with non-VE age-matched control mice. Each point represents one tumor nodule; 1-way ANOVA, *P < 0.05 (n = 4–6 mice). (B) Area of relapsed eye tumors from VE mice on normal (VE) or Ki20227 diet (VE+Ki) compared with non-VE age-matched control mice. Each point represents one tumor nodule; 1-way ANOVA, **P < 0.01 (n = 3–5 mice). (C) Percentage of Ki67+ cells in metastases from VE mice on normal (VE) or Ki20227 diet (VE+Ki) compared with non-VE age-matched control mice. Each point represents one tumor nodule; 1-way ANOVA, *P < 0.05 (n = 3–5 mice). (D) Area of metastases from VE mice on normal (VE) or Ki20227 diet (VE+Ki) compared with non-surgical age-matched control mice. Each point represents one tumor nodule; 1-way ANOVA, *P < 0.05, **P < 0.01 (n = 3–7 mice).
