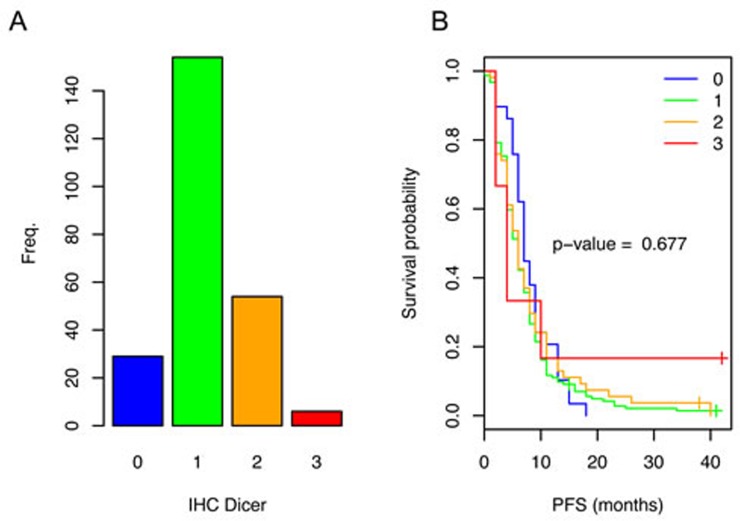
Figure 1. Dicer expression in the primary tumors of patients with mCRC and the related PFS.
A. Variable Dicer staining intensities were observed (IHC0-3). The number of patients per category of Dicer staining are depicted in a bar plot. B. Kaplan-Meier survival analysis comparing CRC patients with different Dicer staining intensities in the tumor. No significant association between PFS and Dicer staining was observed.

