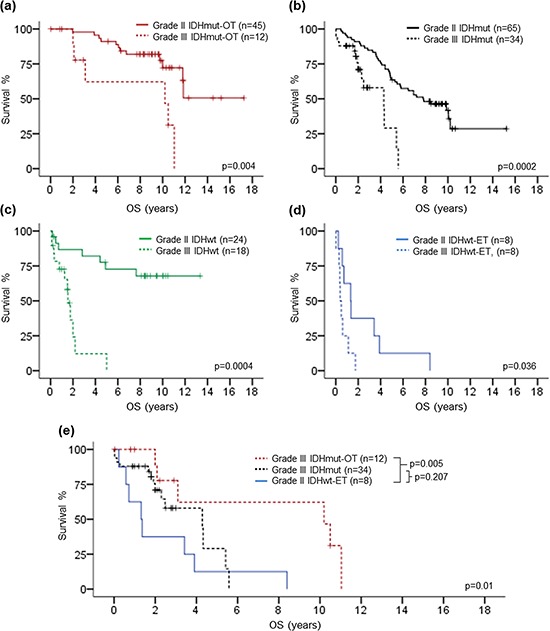
Figure 5. Kaplan-Meier survival analysis of histological grade in each of the genetic signature subgroup.

Histological grade showed prognostic association in IDHmut-OT gliomas a. IDHmut gliomas b. IDHwt gliomas c. as well as IDHwt-ET gliomas. Grade II IDHwt-ET gliomas demonstrated shorter overall survival than grade III IDHmut-OT gliomas and trend of shorter overall survival than grade III IDHmut gliomas e. OS, overall survival.
