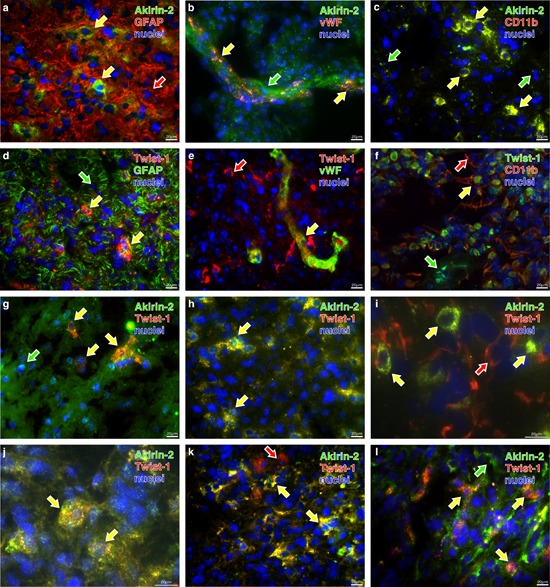
Figure 2. Representative costainings of Akirin-2 and Twist-1 with a-f. cellular markers (glial fibrillary acidic protein (GFAP), von Willebrand factor protein (vWF) and CD11b) and g-l. with each other in human solid GBMs as determined by immunofluorescence microscopy.

a-f. Akirin-2 (green) and Twist-1 (red) are found in different combinations with all cellular markers (red or green, respectively). g-l. Depending on investigated materials Akirin-2 and Twist-1 were detectable in the same tumor cell or were visible independently in different ones. Since different markers are not all localized within the same structures in the cells, signals did not merge (yellow) in all cases, but were found in the same regions. Beside double positive cells also single positive – either for stained Akirin-2 or Twist-1 or cellular marker – and double negative ones were detectable. The arrows indicate single (green or red) or double (yellow) staining of the respective markers. Magnification 400x, bar: 20 μm, representative examples of three independent experiments are shown. For individual images per dye/marker see Supplementary Figs. S1 and S2.
