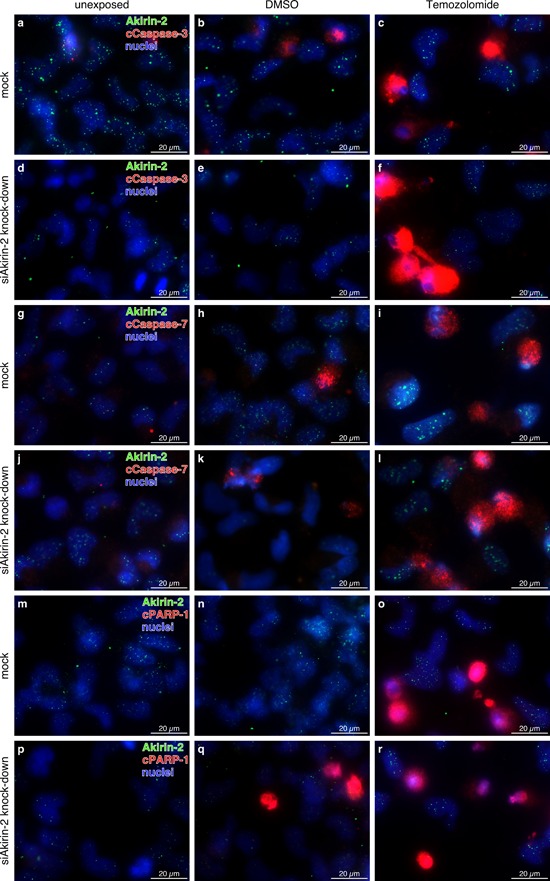
Figure 5. Representative costainings of Akirin-2 (green) with a-f. cleaved (c)Caspase-3, g-l. cleaved (c)Caspase-7, and (m-r) cleaved (c)poly(ADP-ribose) polymerase-1 (cPARP-1) (all red) in unexposed, dimethylsulfoxide (DMSO) or TMZ (400 μg/ml, 24 h) treated mock or siAkirin-2 transfected T98G GBM cells.

Although no clear quantitative data could be obtained, in relation to mock transfected samples (a-c, g-I, m-o) Akirin-2 knock down (d-f, j-l, p-r) resulted in higher amounts of cCaspase-3, -7 or cPARP-1 positively stained cells especially in DMSO and TMZ treated samples. Irrespective of treatment, Akirin-2 knock down became visible by lower intensities and amounts of Akirin-2 positively stained cells. Magnification 400x, bar: 20 μm, representative examples of two independent experiments are shown. For individual images per dye/marker see Supplementary Figs. S5, S6 and S7.
