
Figure 5. Bcl-2 targeting overcomes acadesine resistance.
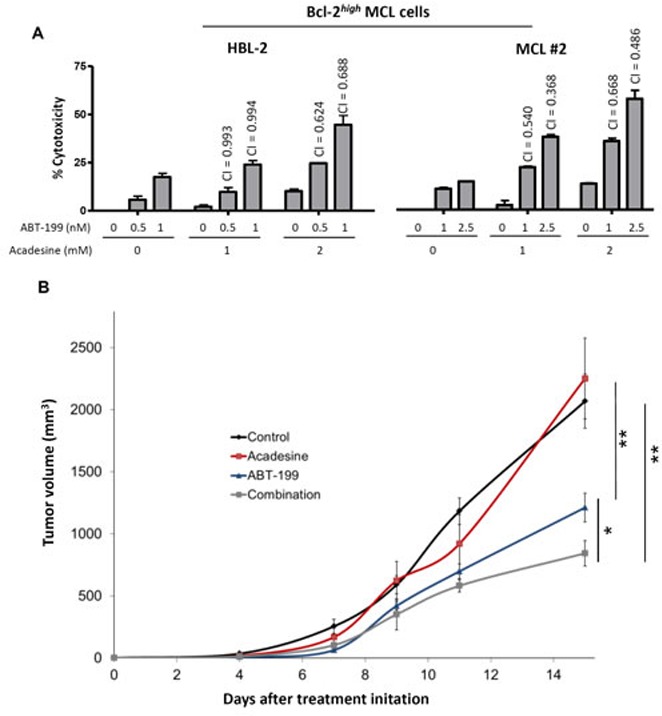
A. HBL-2 cell line and a representative Bcl-2high MCL primary sample were exposed during 24 hours to the indicated doses of acadesine and ABT-199. Graph shows the relative cytotoxicity referred to the untreated samples. CI values are indicated above the bars. B. SCID mice were inoculated subcutaneously with HBL-2 cells and treated with acadesine (400 mg/kg 5 days a week), ABT-199 (15 mg/kg weekly) or both drugs. Tumor growth is represented as the mean ± SEM (n = 4 mice per group) as detailed in “Methods” (*P < 0.05, **P < 0.01).