
Figure 2. p53 expression causes changes in phospholipid profiles in tissues of Mdm2 mice.
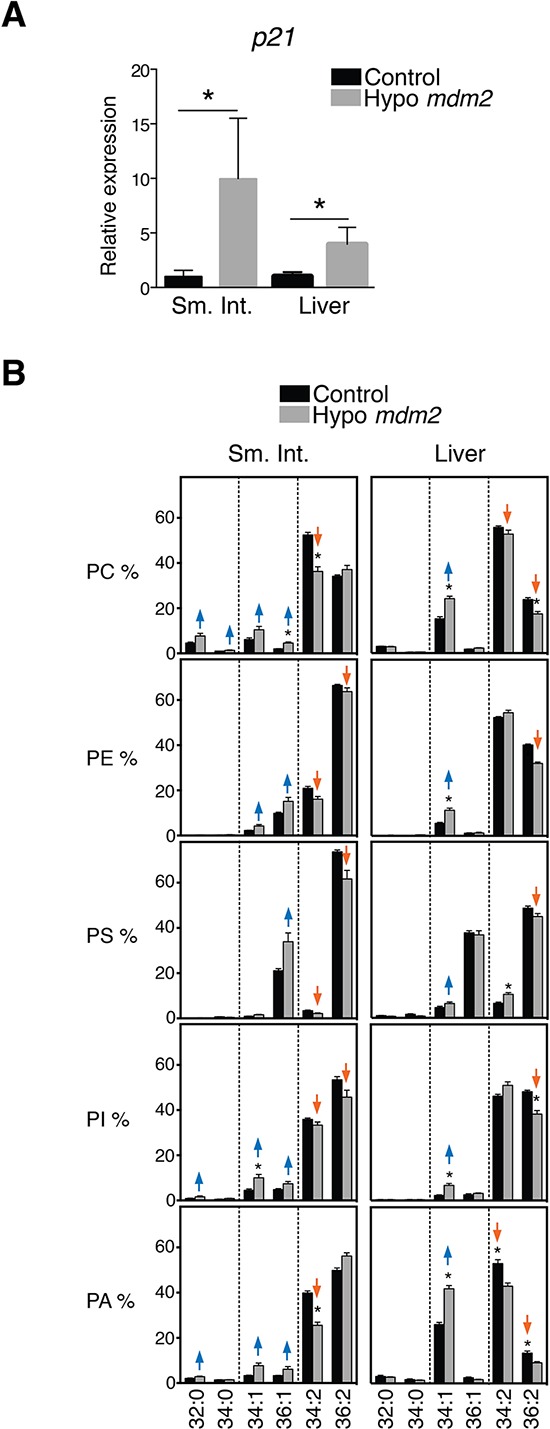
A. p53 activation in hypo Mdm2 mice. p21 mRNA expression in small intestine (Sm. Int.) and liver in hypo Mdm2 and control (n = 3–5). Levels are shown in fold relative to control mice. *p < 0.05, Mann-Whitney test. B. Analysis of PC, PE, PS, PI and PA species in the small intestine and liver from hypo Mdm2 and control mice (n = 4–5). Graphs are organized as explained in the legend to Figure 1. *p < 0.05 by multiple t test and Holm-Sidak correction for multiple comparisons.