
Figure 1. Representative blots showing EAAT2, GLAST-1, PPARγ and β-actin expression in rat cortex, thalamus and glioma cells.
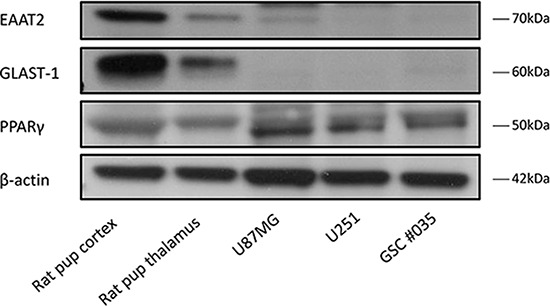
EAAT2 and GLAST-1 are expressed in low levels in glioblastoma cell lines and glioma stem cells.
Official websites use .gov
A
.gov website belongs to an official
government organization in the United States.
Secure .gov websites use HTTPS
A lock (
) or https:// means you've safely
connected to the .gov website. Share sensitive
information only on official, secure websites.
EAAT2 and GLAST-1 are expressed in low levels in glioblastoma cell lines and glioma stem cells.