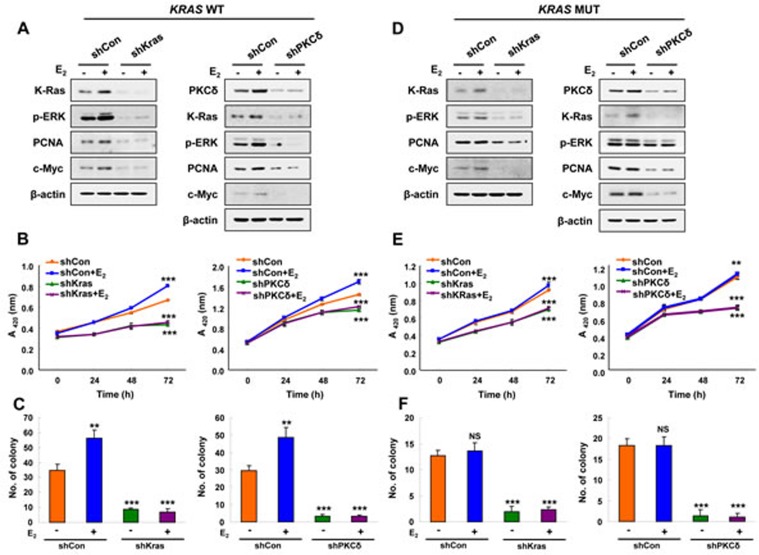
Figure 4. The effects of PKCδ or K-Ras knockdown on E2-induced Ras-ERK pathway activation and cellular transformation.
A., B., and C. Stable shCon, shK-Ras, or shPKCδ Ishikawa cells. D., E., and F. Stable shCon, shK-Ras, or shPKCδ HEC1A cells. (A and D) Cells were treated with/without E2 (10 nM) for 24 h. WCLs were analyzed by western blot analysis. (B and E) MTT assays were performed every 24 h for 72 h after E2 (10 nM) treatment. The results represent the mean ± SD (n = 3). **P < 0.01 and ***P < 0.005. (C and F) Cells were treated with E2 (10 nM) every 3 days for 14 days. Colony numbers were counted. The results represent the mean ± SD (n = 3). **P < 0.01 and ***P < 0.005 compared with control. NS = not significant compared with control.

