
Figure 2. Retention of genetic expression patterns in xenografts.
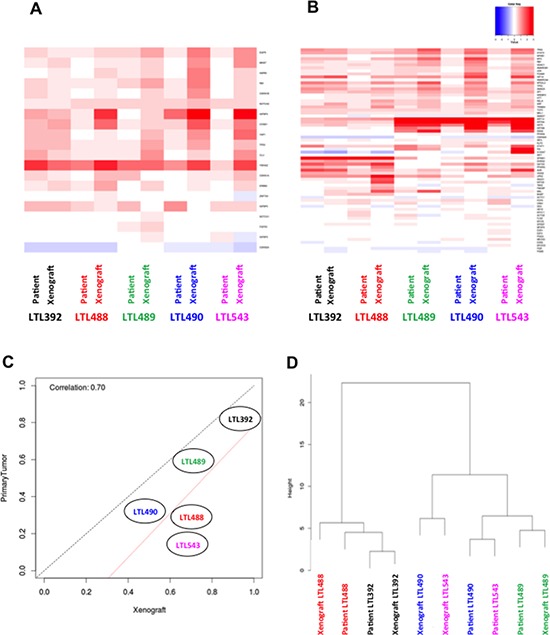
Heat maps of gene expression from potential target substrates A. and bladder cancer related genes B. show no single gene that is highly differentially expressed between patient tumor and matched PDX. C. The RF15 scores for patient tumor samples versus their corresponding PDX illustrate a high correlation in 3 of 5 cases, and a trend towards more aggressive phenotype in 2 PDX. The red line is the line of best fit, and the black line indicates perfect correlation. D. A cluster dendogram was designed using 118 genes related to bladder cancer. Sample pairs (primary tumors and corresponding PDX) tended to cluster together, except for LTL490 and LTL543. The matched PDX - primary tumor pairs are represented with the labels of the same color.