
Figure 3. Bioinformatics analysis of the DU145 Tax-Sen and DU145 Tax-Res exosomal proteome.
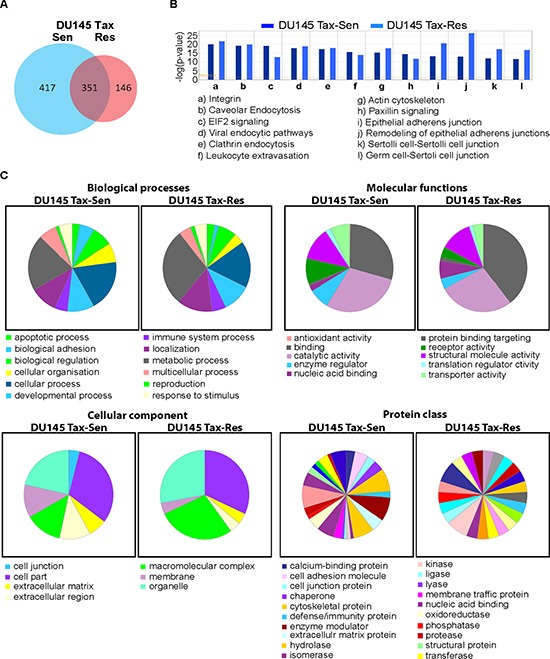
(A) Venn Diagram constructed from the unique and shared proteins identified in DU145 Tax-Sen and DU145 Tax-Res exosomes; (B) Ingenuity pathway analysis of the signaling cascades identified in the proteomics analysis; (C) Pie charts from the classification analysis (PANTHER 9.0) of the biological processes, molecular functions, cellular components and protein classes.