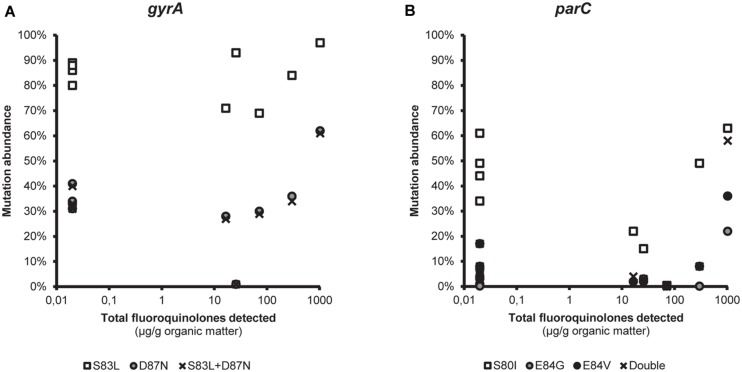
FIGURE 2.
The link between fluoroquinolone pollution and mutations in the quinolone resistance determining region. Correlation between the measured total fluoroquinolone pollution (μg/g organic matter) and the relative abundance of the most commonly detected non-synonymous substitutions in (A) gyrA and (B) parC. Samples with no detected fluoroquinolones are indicated in the figure as 0.2 μg/g (i.e., the detection limit).

